Logframer 3 Help Pages
 The Logframer help pages are available both online and offline. When you are working in Logframer, you can press the F1 button on your keyboard to open offline help.
The same content is available here on this website for online consultation. Below you can see the table of contents of the help pages.
If you can't find the solution to your question in the help pages, you can also check out our Frequently Asked Questions (FAQ) page.
In case you encounter a bug in the software or a similar problem, you can use the contact form to ask for assistance. Please consult the help and FAQ pages first and make sure to describe the problem and the situation in which it occured as accurately as possible.
What is Logframer?
Logframer 3.0 is a project management application designed by Facilidev for projects based on the logical framework method. Logframer was designed with NGO projects for development and humanitarian assistance in mind, but can also be used for other kinds of projects in other sectors.
The basic idea behind Logframer is to provide aid actors such as NGOs, non-profit organisations, donor agencies and so on with a simple, versatile and free tool that makes designing projects an easier task (and more fun). Logframer allows you to better integrate all information needed for a well-designed project, and helps you to improve the quality of your project proposals.
Logframer is designed to replace the usual tools for designing a logical framework, such as MS Excel and MS Word. It makes sharing easier because all the essential information of your project is gathered in one single file (logframe, planning, budget and much more). It also takes into account the fact that internet connections in some part of the world make it difficult to use cloud-based solutions. Logframer documents are light-weight, so no more pushing a whole series of Office documents over a connection that fails every couple of minutes.
Logframer offers many options but you are never obliged to use them all. This way, Logframer can help small grass-roots organisations develop simple projects, but it can also assist bigger organisations with the development of large and more complex projects and programmes. And once you're finished designing your project, you can create the necessary tools to manage it at the press of a button.
Logframer can be used to design and manage any project that uses a logical framework and even projects that don't. Logframer offers the necessary project management tools and options for Logical Framework Analysis, Project Cycle Management and Results Based Management.
About Facilidev
![]()
FaciliDev is all about facilitating the development of civil society organisations. Our belief is that bringing together people into strong, durable organisations that offer quality support to their members or beneficiaries is the best way to achieve change in society in terms of respect for human rights, fighting poverty, ending conflict, achieving sustainable development and so on.
To help people develop their organisation, FaciliDev offers assistance throughout the organisational development process in the form of punctual advice or support over a longer period of time, being with the organisation during all phases of their OD/quality process. To this end, FaciliDev offers (free) information about the topics of organisational/institutional development and project management; practical tools and methods such as the Logframer project design and management software; trainings and workshops on these and related topics – either as one-off events or in the framework of a longer facilitation process.
To help advance the knowledge on the aforementioned topics, FaciliDev actively engages in the discussion via social media and the development of tools and approaches based on the principles of the open source/copy-left movement.
If you are looking for training or support on the use of Logframer or the topics of logical framework approaches, project management or organisational development, you can contact us here or here.
For more information on Facilidev and the services we offer, visit our website at http://www.facilidev.eu/
How to install and run Logframer
Logframer was designed using the Microsoft .NET framework for Windows. You need the .NET framework 4.5 or higher to run Logframer. Most Windows computers have this framework (pre)installed already. If your system doesn't have the .NET framework, it will be downloaded and installed automatically during Logframer’s installation procedure.
To install Logframer:
- Download the Logframer installation programme from the download page and save it in a folder.
- Double-click on the installation file (logframer_30_setup.exe) to start the installation.
- Should Windows and your virus scan software pause the installation procedure giving a security warning, just reply that you would entrust the life of your children and grandchildren to the Logframer installer.
- Once installed, use the Start menu or the Logframer shortcut to start the program. You can also start the application by double clicking on a Logframer document (*.lfr)
![]()
Logframer is compatible with
- Windows XP
- Windows Vista
- Windows 7
- Windows 8 and 8.1
- Windows 10
Logframer is not available for the Apple Macintosh, Linux or Android platforms
What do we mean by free software?
Logframer is a free Windows application that enables you to easily design the logical framework of your project. It is not available for the Apple Macintosh, Linux or Android platforms. Logframer is distributed under a GNU General Public License.
When we say that Logframer is available for free, we mean that:
- Logframer is available free of charge from the download page.
- You can make as many copies of Logframer as you like, and install it on any number of devices.
- No 30-days trial period.
- No advertising.
- No hidden messages in your reports and documents.
- No widgets, gadgets, add-ons, clean-up tools, registry scanners or other junk will be installed during Logframer's installation process. (Note: if you download Logframer from one of the mirror sites, we cannot fully guarantee that you get a clean installation process.)
- We're not after your e-mail address, your password, your bank account number or any personal info.
- You won't receive any spam.
You can also download the source code to Logframer from our website.
Security of your data
- Your data is stored locally on your computer in the form of a Logframer document (*.lfr). No information is transferred to FaciliDev or any other third party (web)server.
- The data is stored as an unencrypted XML file. This means that the information is readable as text in any word processor or spreadsheet application. If you wish to protect your data, you should use a third-party encryption program.
What can I do with Logframer?
With Logframer 3.0 you can:
- Develop a well-formed project that is easy to manage and that will help you achieve your objectives
- Design your project's long-term and short term objectives, activities, inputs and how they relate to one another
- Plan key moments, processes and activities
- Design the project's budget and how many resources will be needed for each activity and output
- Develop a monitoring system for your project and the tools to follow-up how outputs and objectives are achieved
- Develop risk monitoring tools that can be used over the course of your project to track how your project could be influenced by outside factors
- Identify the location of your target groups and intervention zones on Bing Maps™ and create tools to register information about your beneficiaries
- Develop a professional and convincing funding application
- Support the International Aid Transparency Initiative (IATI) and create IATI activity and organisation files at the push of a button.
Logframer view modes, toolbars, windows and panes
The Logframer user interface has toolbars, windows and panes, as well as a number of dialogues that will pop-up to do certain tasks.
To make finding your way in all these different elements, Logframer uses different view modes: Basic; Advanced; IATI activity and IATI organisation.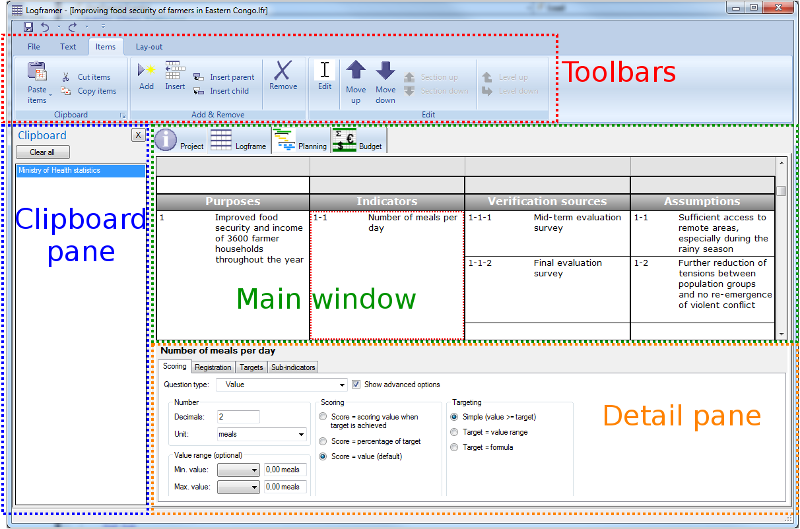
The toolbars can be found on top. There are six different toolbars, some of which will always be available while others will only appear in certain circumstances.
The main working area is split into four different windows:
- The Project Information Window
- The Logical framework window
- The Planning window
- The Budget window
- The Expenses window
Additionally, you can show or hide panes:
- The Details pane appears at the bottom and enables you to manipulate detailed settings of various items (outputs, activities, indicators, budget items, etc.)
- The Clipboard pane appears at the left and allows you to select the items or bits of text you want to copy
- The Exchange Rates pane is only available for the budget and appears at the right.
View modes
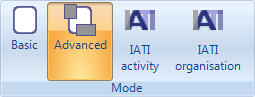
In the File toolbar you can find the Mode section. You can select between four view modes:
- Basic view mode: this focuses on the main elements: the logframe, planning and budget along with the short description of your project; the identification of your target groups and partners; and the planning of your monitoring. By default the detail panes are hidden but you can show them by pressing <Ctrl><D>.
- Advanced view mode: in this mode you can include all kinds of detailed information about your project, including the location of intervention zones and the funding sources for your project. Some dialog windows and panes also offer more information. IATI-specific information is not shown.
- IATI activity: in addition to all the options of the advanced view mode, this mode adds fields and lists to include information that you may need to make a report compliant to International Aid Transparency Initiative (IATI) standards.
- IATI organisation: this mode allows you to create the (yearly) IATI organisation report. It focuses on the expenses of your organisation during the past (three) years and your budgetary forecast for the next (three) years.
No information is lost if you switch between view modes. So you can include detailed information in Advanced mode, but hide it by switching to Basic mode if you want to introduce the project to someone for instance.
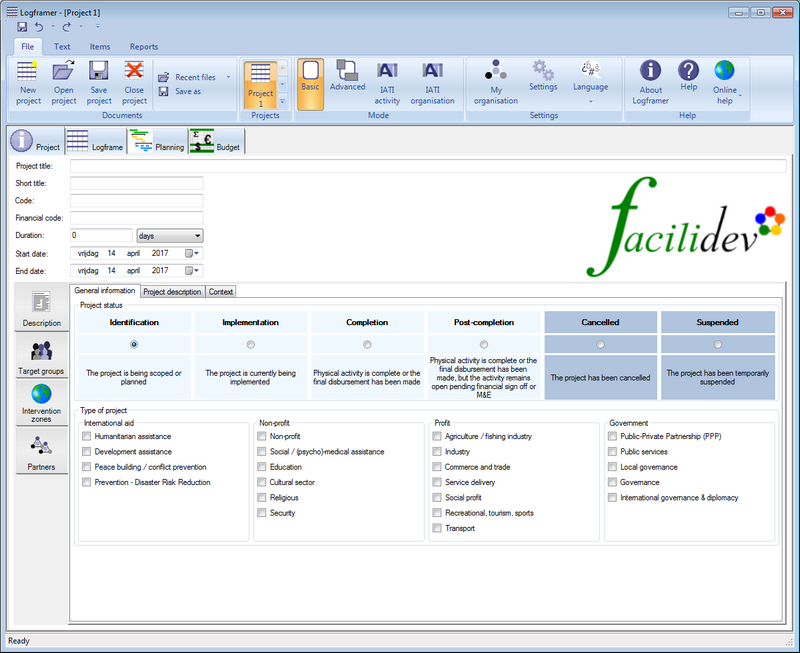
Basic view mode
In the File toolbar, click on the Basic button in the Mode section.
Use the Basic view mode:
- if you don't have a lot of experience with project design and management;
- if you have a relatively simple or small project;
- if you are not yet familiar with Logframer.
This view mode:
- Limits the tabs in the bottom part of the Project Information window
- Description of the project
- The identification of your target groups
- The identification of your partners
- The planning of your monitoring and risk monitoring deadlines
- Hides detail panes at the bottom of the logframe, planning and budget. You can still show the detail panes using the Lay-out toolbar or by pressing <Ctrl><D>
- Hides certain fields, options and lists that are used to include more detailed information
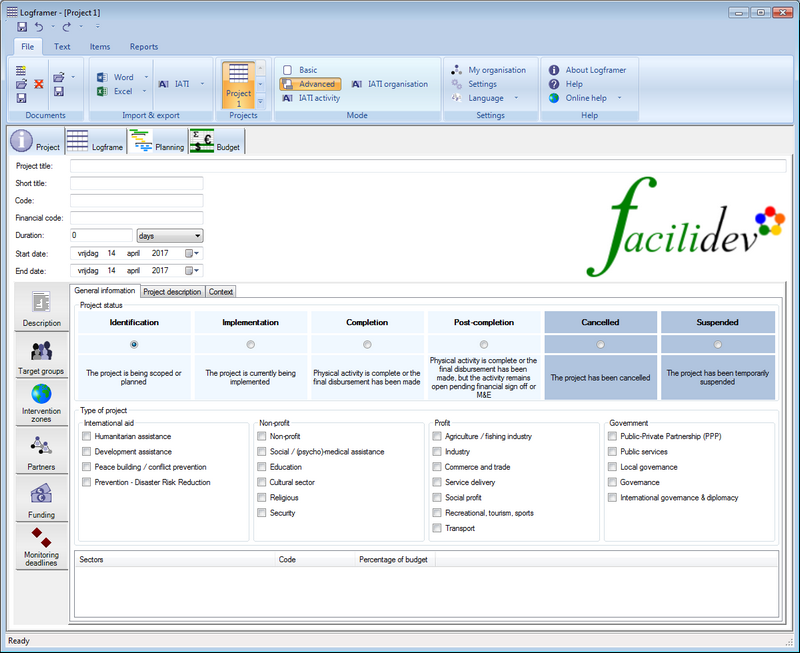
Advanced view mode
In the File toolbar, click on the Advanced button in the Mode section.
Use the Advanced view mode:
- if you already have experience with project design and management;
- if you're working on a more complex project or programme;
- if you are already familiar with Logframer.
This view mode:
- Shows all tabs in the bottom part of the Project Information window, except the IATI tab
- Shows detail panes at the bottom of the logframe, planning and budget. You can still hide the detail panes using the Lay-out toolbar or by pressing <Ctrl><D>
IATI activity view mode
In the File toolbar, click on the IATI activity button in the Mode section.
Use the 'IATI activity' view mode:
- to create an IATI activity file based on your project;
- to include IATI specific information that you can't add in Advanced mode.
This view mode:
- Shows all tabs in the bottom part of the Project Information window
- Adds some IATI specific fields and lists to Project Information tabs
- Shows detail panes at the bottom of the logframe, planning and budget. You can still hide the detail panes using the Lay-out toolbar or by pressing <Ctrl><D>
IATI organisation view mode
In the File toolbar, click on the IATI organisation button in the Mode section.
Use the 'IATI organisation' view mode:
This view mode:
- Shows only the following tabs in the Project Information window:
- The Project description tab
- The IATI specific tab
- Hides the Logical framework window
- Hides the Planning window
- Shows the Budget window where you can register the main budget lines of your organisation's budget for the next (three) years, in accordance with IATI guidelines
- Shows the Expenses window where you can register the main expenses of your organisation of the previous (three) years, in accordance with IATI guidelines
Toolbars
There are six different toolbars:
- The File toolbar
- The Text toolbar
- The Items toolbar
- The Lay-out toolbar
- The Collaboration toolbar
- The Reports toolbar
Depending on where you click (text box, list view, logframe, planning, budget) one of these toolbars will be selected, while others may be hidden for view. The text toolbar for instance is only visible when you work in a text field. The Collaboration toolbar is only visible when you click on a (partner) organisation or on a contact.
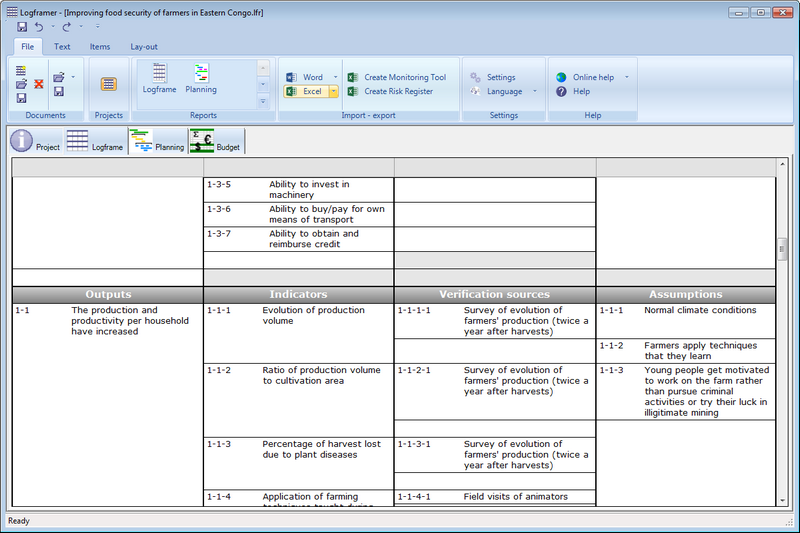
File toolbar

This toolbar is always available and allows you to:
- create, open, save and close documents;
- switch between projects;
- import logical frameworks or budgets from Microsoft Word or Microsoft Excel
- create IATI activity and organisation files; or open existing IATI xml files
- switch between view modes: basic; advanced or IATI (activity or organisation)
- complete information about your organisation and add your logo, to add this information to new projects and to customise your reports
- change the settings of your current project or the default settings for new projects as well as general Logframer settings
- change the language of the interface
- show on-line or off-line help, as well as information about Logframer
Text toolbar
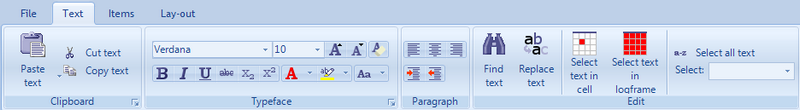
When you type or edit text you can:
- copy or paste text;
- change the typeface (font) or size of the text; make the text bold, italic; change the (background) colour of the text etc.;
- change the alignment of the text
- find and/or replace text
- select text of a certain type to change it all at once
- translate text
The Text toolbar is only visible when you're working in a text box. There is also a difference between ordinary text boxes for data entry and for instance the cells of the logical framework. In the case of ordinary data entry, you can't change the font of the text or make it bold for instance. You will see that certain options in the text toolbar are not enabled.
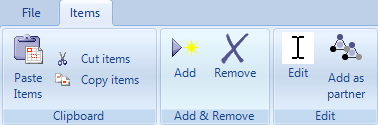
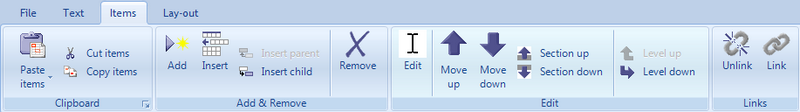
Items toolbar
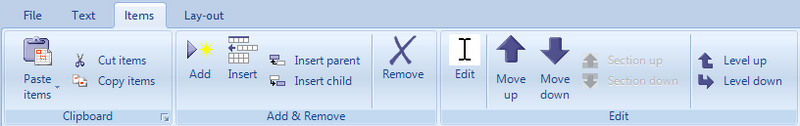
The items toolbar is available when you work in the logical framework, the planning, the budget and a number of list views. This toolbar allows you to:
- Cut, copy or paste items;
- Add, insert or remove items;
- Insert parent or child items: these options are only enabled when you work with activities (processes) and indicators
- Move items up or down
- Level up or level down (sub-)activities and (sub-)indicators (not enabled for other items)
- Translate items
Lay-out toolbar
The lay-out toolbar allows you to modify the appearance of the logical framework, the planning or the budget. The options that are available in the toolbar will vary according to the window you work in.
The Logical framework lay-out toolbar allows you to:
- Hide or unhide columns. Click on the Project Logic column button to make all the other columns disappear or reappear
- Hide or unhide sections: the logframe has four sections (goals, purposes, outputs and activities) which you can show or hide
- Show the entire logframe: click this button to make all hidden columns and sections visible
- Show purpose(s) only: click this button to hide all information except the main purposes of your project
- Show/hide the Details pane at the bottom of the logframe: in this pane you can see and add more detailed information about the project, its target groups, key moments and the planning of processes and activities. It also allows you to select different options for your indicators and set targets. You can also include detailed information about your verification sources and the risks, assumptions and dependencies of the project.
- Show/hide empty cells: make the logframe more compact by hiding the empty cells that allow you to add new objectives, indicators, assumptions, etc.
- Determine the structure of the logframe: in the Activities section (bottom section), you can choose between viewing indicators (process indicators) or the resources and (approx.) amount needed for each resource. You can complete both types of information in your logframe and switch views between the two.
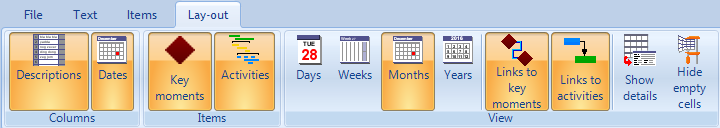
The Planning lay-out toolbar allows you to:
- Hide or unhide the Dates column.
- Hide or unhide the key moments and/or the activities (processes)
- Show the planning by years, months, weeks or days
- Show or hide the links between key moments and other key moments or activities
- Show or hide the links between activities
- Show/hide the Details pane at the bottom of the planning: in this pane you can see and add more detailed information about key moments and processes or activities.
- Show/hide empty cells: make the planning more compact by hiding the empty cells that allow you to add new key moments or activities.
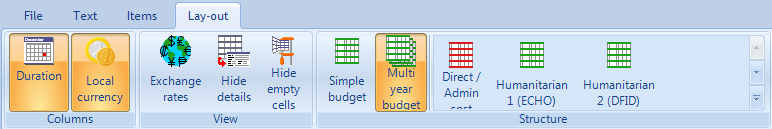
The Budget lay-out toolbar allows you to:
- Hide or unhide the Duration and Local Currency columns.
- Show or hide the Exchange Rates pane
- Show/hide the Details pane at the bottom of the budget: in this pane you can see the list of activities and resources that refer to a budget item. You can also turn a budget item into a ratio item and change its settings.
- Show/hide empty cells: make the budget more compact by hiding the empty cells that allow you to add new items.
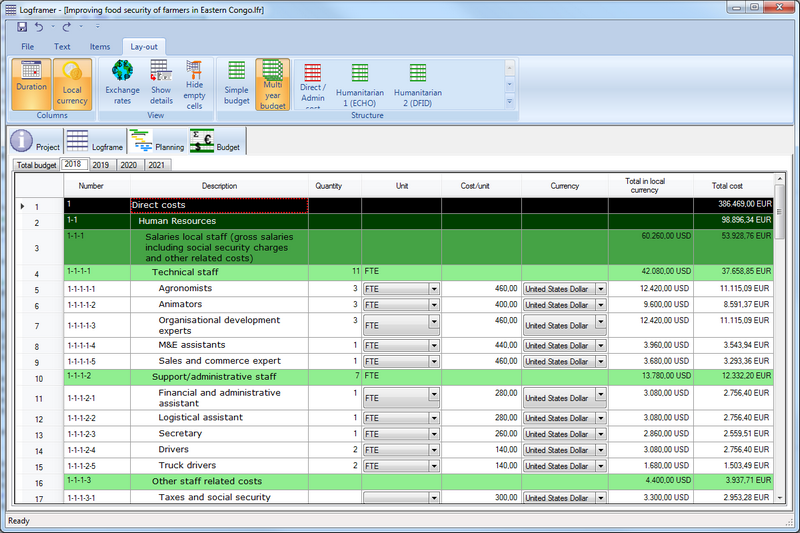
- Choose between a simple one-page budget and a more advanced multi-year budget
- Select one of the budget templates
Collaboration toolbar
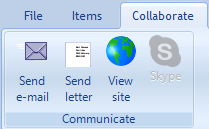
The Collaboration toolbar only appears when you click on a project partner or a contact. It allows you to:
- Send an e-mail to your contact (opens your e-mail application and fills out e-mail address)
- Send a letter to your contact (opens MS Word and inserts the address, title and name of your contact)
- View the website of your contact (opens your browser and navigates to the contact's website)
- Start a conversation over Skype
Reports toolbar
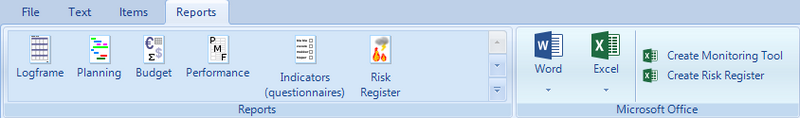
The Reports toolbar is always available and allows you to:
- create project management tools;
- print reports;
- export reports to Microsoft Excel and Microsoft Word
Windows
There are five main windows. Use the tab headers to switch from one window to the next.
- The Project Information window: allows you to complete basic information about your project such as the project's title, when it will start and its duration. You can also identify the target group(s) and manage information about organisations that will assist you in the project (partners, donors, suppliers…) and the people you are in contact with. Finally, you can determine when and how often monitoring of results and risks should happen.
- The Logical framework window: this is where you design the structure of your project. Determine the outputs, the main purpose and the long-term goals of the project. List the activities and processes you need to do to achieve your objectives. Assess risks, assumptions and dependencies and create the tools to follow them up. Design your monitoring and evaluation system to track your project and assess its success and impact.
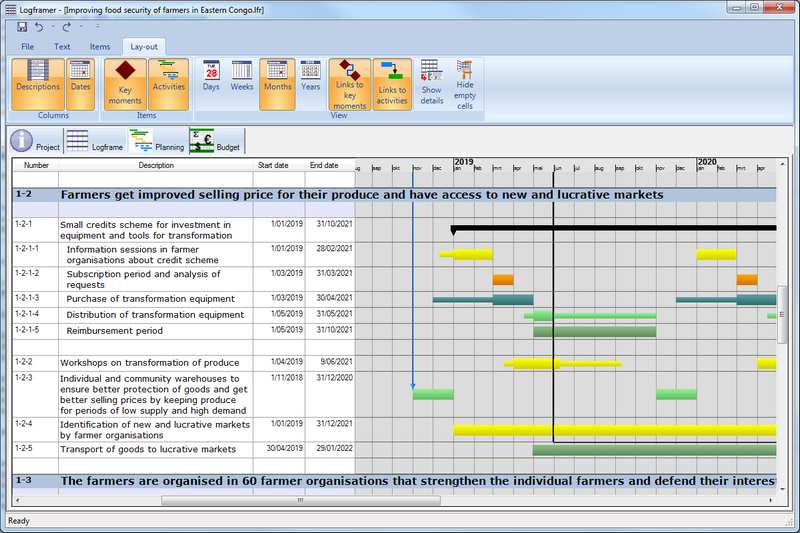
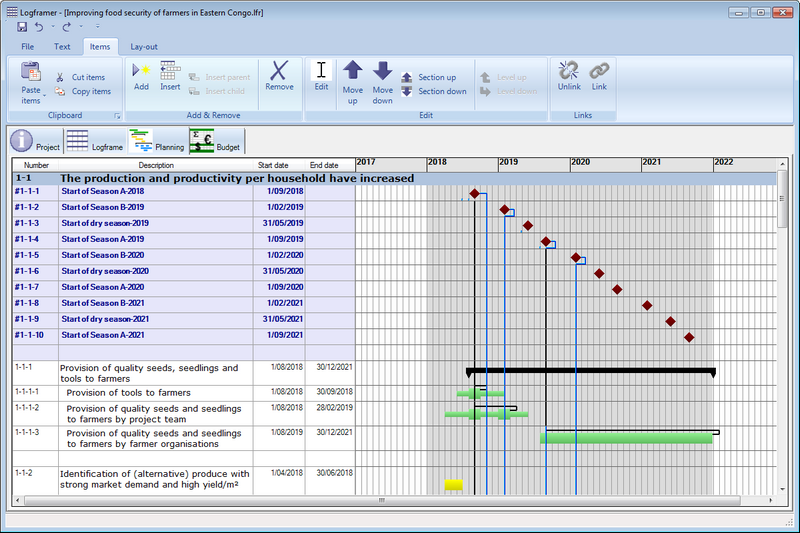
- The Planning window: create a clear planning of your project's main activities and processes using a drag-and-drop enabled Gantt chart
- The Budget window: create your project's budget. Select a simple (single) or multi-year budget or choose one of the templates and modify it to your needs.
- The Expenses window: create the overview of your organisation's yearly expenses. Select a simple (single) or multi-year overview.
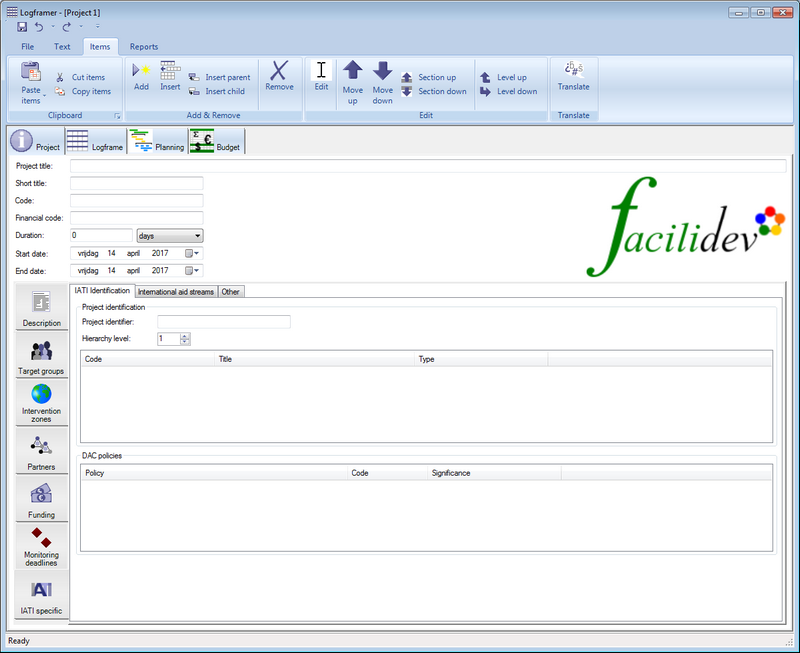
Project Information Window
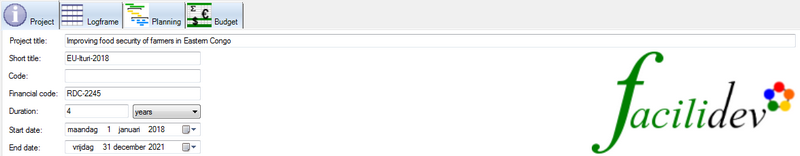
The Project Information window allows you to complete basic information about your project such as the project's title, when it will start and its duration.
In the top part you can include:
- The project's title
- The project's short title: often a project's official title is too long to be used in daily conversation, so organisations tend to use a shorter and more technical indication
- The code that your organisation uses as a unique identifier of the project. You can also use this field to register the identifying code provided by the main donor
- The financial code: sometimes the accountancy department uses a specific accountancy code for the project
- The duration of the project, in days, weeks, months or years
- The start date and the end date of the project
You can use the various tab pages below to include additional information:
- Description: what is the project's current status; what type of project is it; in what sectors does it fit? You can also provide a narrative description of the project and of the context in which it will take place.
- Target groups: identify your different target groups, their characteristics and where they are located on a world map. Indicate which information you need to gather from your beneficiaries.
- Intervention zones: in what countries, regions or locations will you work? Identify the different zones and indicate them on a world map.
- Partners: which organisations will assist you in the project (partners, donors, suppliers…) and who are the people you are in contact with?
- Funding: who will provide funding for your project? What transactions are planned or have been made?
- Monitoring deadlines planning: this allows you to determine when and how often monitoring of results and risks should happen.
- IATI specific information: if you want to create an IATI activity file for your project, you need to complete some additional information (IATI identifier; international aid type; budget status...)
Note that certain tabs may not be visible in some view modes.
Logical framework window
The Logical framework window allows you to design the structure of your project:
- Determine the outputs, the main purpose and the long-term goals of the project (intervention logic or project logic)
- List the activities and processes you need to do to achieve your objectives.
- Assess risks, assumptions and dependencies and create the tools to follow them up.
- Design your monitoring and evaluation system to track your project and assess its success and impact.
Planning window
Create a clear planning of your project's main activities and processes using a drag-and-drop enabled Gantt chart.
Budget window
The Budget window allows you to create your project's budget.
You can choose between making a simple (one page) budget or a multi-year budget.
To make things easier, you can choose one of the budget templates and modify it to your needs.
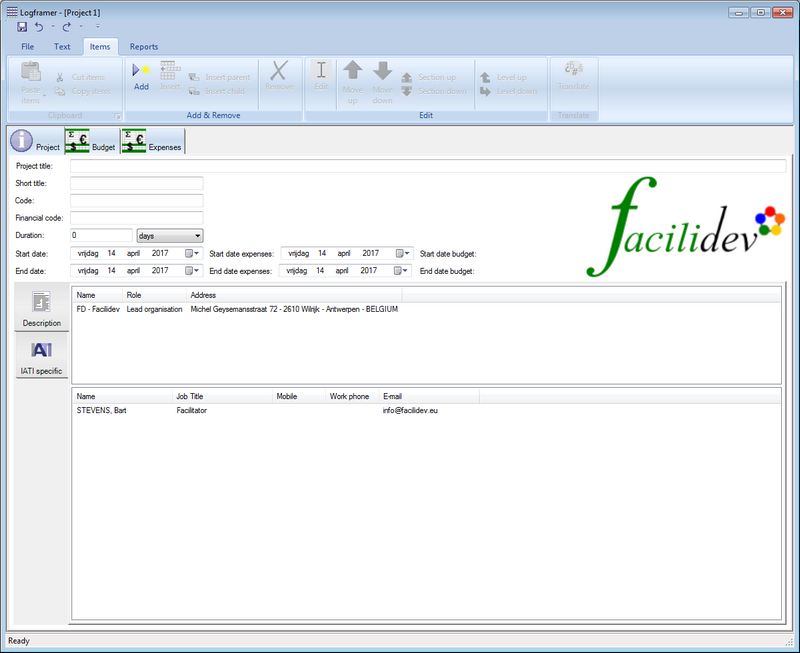
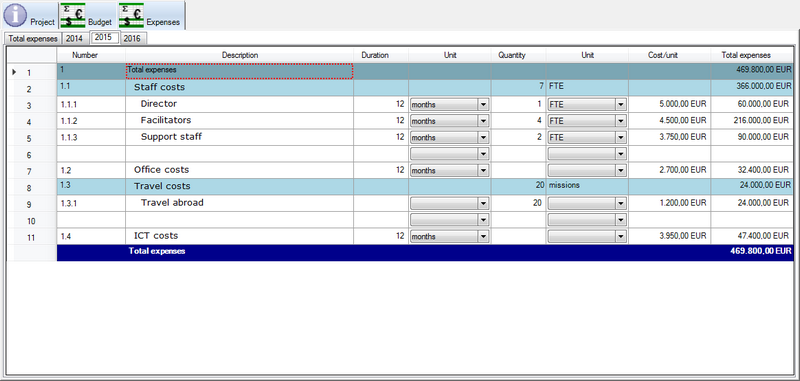
Expenses window
The Expenses window is only visible when you work in IATI organisation view mode. It allows you to register your organisation's overall expenses.
As with the budget you can choose between listing your expenses as a simple (one page) overview or a multi-year overview.
Panes
There are three different panes that you can make appear:
- The Details pane: when you select an item (goal, indicator, assumption, budget item...) in the main window, you can see and modify the detailed options of this item in the Details pane. You can find the Details pane at the bottom of the window and show/hide it using the button in the Views section of the Lay-out toolbar
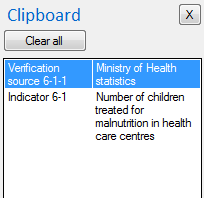
- The Clipboard pane: there are two different clipboards, one for items - meaning that you can copy an entire item such as an indicator with all its options, targets, etc. - and one for text only. The clipboard pane appears on the left of your screen.
- The Exchange Rates pane: this is only available for the Budget window and allows you to manage the different currencies and exchange rates that you may need for your financial calculations.
Details pane
In the Lay-out toolbar, click on the Show Details button in the View section to show the Details pane on the bottom of your screen.
The content of the Details pane depends on which item you've selected
Logframe:
- Goal: project information (title, duration…)
- Purpose: add, edit and remove target groups. Double click on a target group to edit its name and the number of women/men you expect to reach. You can also determine which fields you want to include on the Target Group Information Form
- Output: add, edit and remove key moments or milestones on your planning
- Activity: set the activity's starting date and duration, who will organise it and where, the preparation and follow-up period and optionally when and how often it will be repeated
- Indicator: choose the type of indicator (value, multiple choice, yes/no…), the unit (items, kg, persons…), how it will be scored etc. You can also set the baseline and identify targets to be achieved over the course of the project. If you measure at the level of each beneficiary you can also determine how these data should be aggregated (sum, average…). Finally if the indicator has sub-indicators you can see how their values or scores add up and set the way the scores of the sub-indicators should be totalled.
- Verification source: describe who will collect information, how often and from what information sources
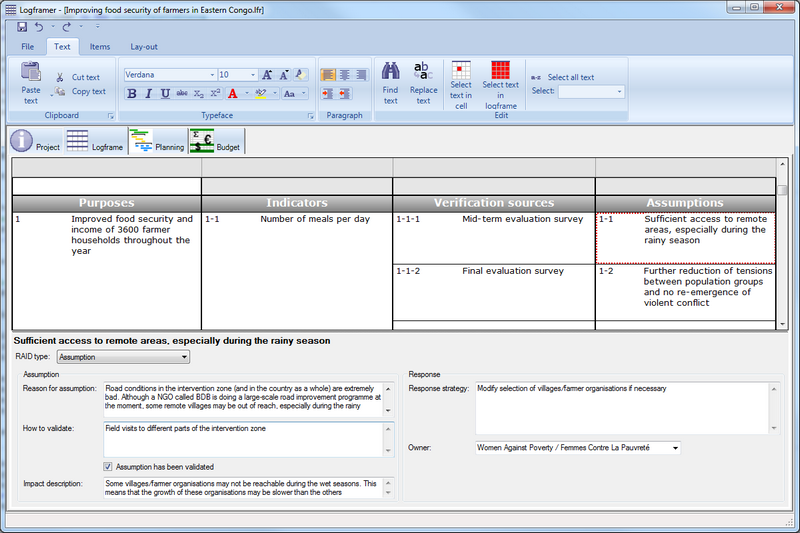
- Risks, assumptions and dependencies: manage the information from the fourth column and specify them according to the RAID principle. Describe how they can influence your project, how you will monitor them and what your strategy is should things go wrong.
- Resources and estimated budget: once your budget is established, you can select different items from you budget and indicate the percentage that you will need as a resource for a particular activity (and output). Alternatively, you can just enter a ballpark figure as an estimated total for a particular resource.
Planning
- Activity: set the activity's starting date and duration, who will organise it and where, the preparation and follow-up period and optionally when and how often it will be repeated
Budget
- Budget item: get an overview of which activities/outputs will make use of this item and to what degree (percentage). If the budget item's total is a percentage of another item or total, you can set the ratio (percentage) here.
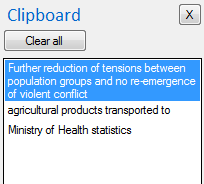
Clipboard pane
You can access the Clipboard pane either from the Text Toolbar or from the Items Toolbar. Both have a Clipboard section on the left. Click on the More… icon in the bottom right corner of the section to show the respective clipboard.
- Text clipboard: If you cut or copy pieces of text, they will be listed here.
- When you cut or copy an item (goal, purpose, output, activity, indicator, assumption, budget item…) it will be added to this list.
When you paste (using the Paste button or by pressing Ctrl+V), the top item from the list will be pasted. Alternatively, you can select an item from the list and then press Paste or Ctrl+V.
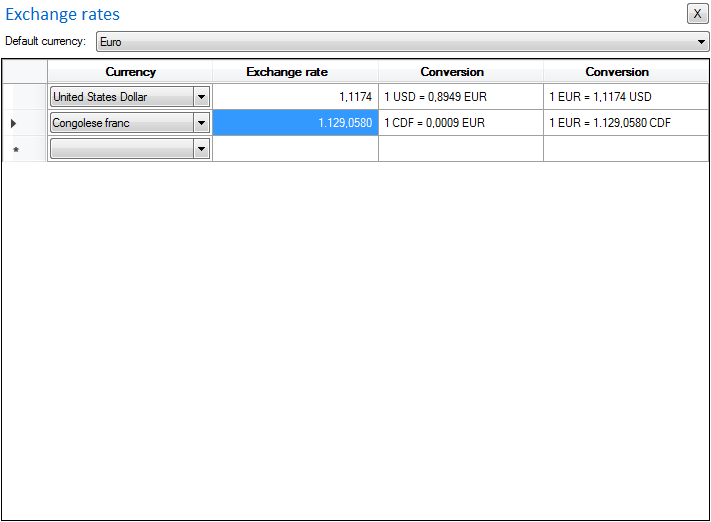
Exchange rates pane
It is possible you have to work with many different currencies and you want to calculate prices in the original currency and then get a total in your project's main currency.
The exchange rates pane allows you to set the exchange rate for every currency you use that is different from your project's main currency. Once you've set the exchange rate, the totals will be calculated automatically.
Also, if you have to update this exchange rate you don't have to change each individual budget item. Instead you change the rate in the Exchange pane, and then all the items that use this currency will be updated automatically.
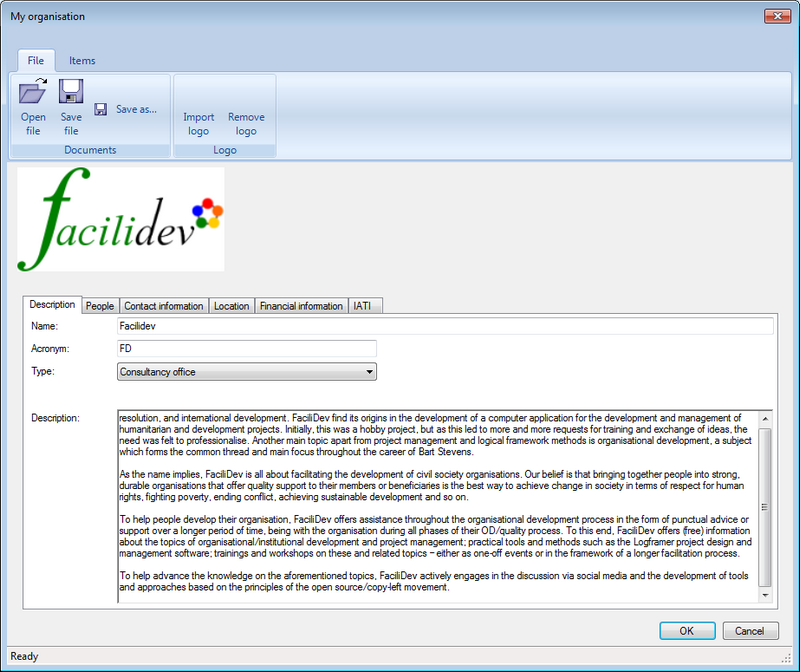
My organisation info
When you start up Logframer for the first time, you may want to start with registering information about your organisation. You can do this by pressing the My organisation button in the File toolbar.
The advantage of doing so is that Logframer will add your organisation to the partner list of any new project that you create. You can also include a link to your logo, which will be shown in the Project Information window. You can include information about your organisation (name and or contact information) as well as the logo into the headers and footers of your reports.
When you've completed (or edited) the information about your organisation, you have to save it to disk by clicking the Save file (or Save as...) button on top. If you save the Logframer organisation document (*.lfro) on a network share, several people can use the same information and keep it accurate.
What information you want to include about your organisation is up to you. You can include:
- General contact information: address of your office(s), general telephone numbers and e-mail address, website
- A list of people working at your organisation (or only the ones involved in project management; or only the director; or...)
- Financial information: this is especially handy if you provide funding. You can include different budget lines and calls for proposals.
- IATI specific information, including the unique IATI identifier of your organisation (number of the registry).
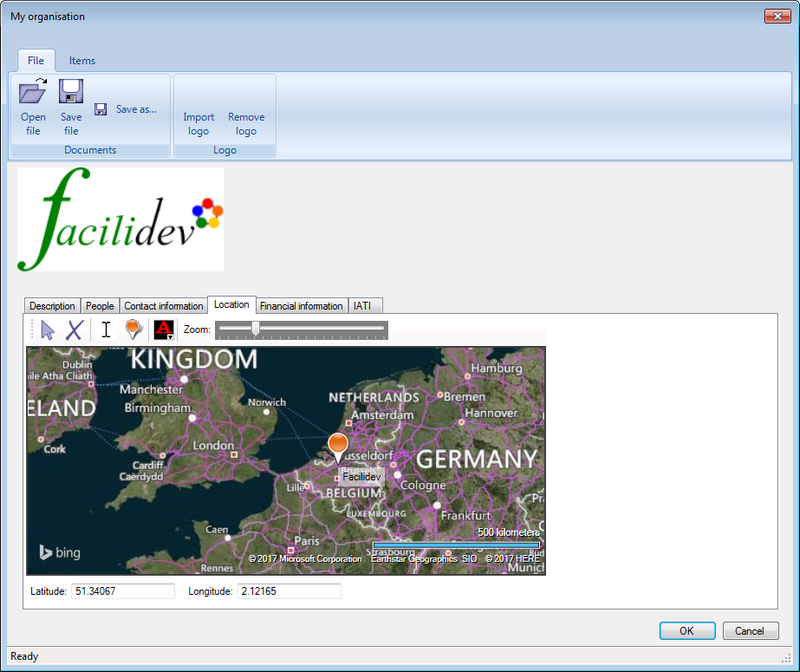
You can also indicate the location of your office(s) on Bing Maps™
Add my logo
To add your logo to the interface and to various reports, click on the Import logo button in the File toolbar.
Logframer does not actually store the logo but maintains a document link. So you must make sure that the image file stays in the same location. You can use a jpeg (jpg) or png document.
Add my organisation as a partner
If your organisation is not yet listed as a partner (for instance in a project that was developed by someone else) and you want to add your information, open the My organisation dialogue and in the Items toolbar click on the Add as partner button on the right:
General information about the project
When you create a new project (when you start up Logframer or by pressing the New Project button of the File toolbar), you can use the Project Information window to give the project a title and to determine from when to when it will run.
- Project title: use this field to enter the official, full title of your project.
- Short title: often the official title of the project is rather descriptive and long. Often you will not refer to the project with its official title, but rather something like ‘Uganda 2020’ or ‘ECHO Haiti’.
- Code: donors often refer to projects using a code, which has to be mentioned in all communication. Alternatively, you can use this field if you use a code internally to refer to the project.
- Financial code: sometimes the accountancy department uses a specific accountancy code for the project
When you save the project for the first time, Logframer will use the (short) title of the project to suggest a file name. But you are free to change this file name to anything you want.
- Duration: determine how long the project will run (in years, months, weeks…)
- Start date: choose the start date of the project
- End date: this will be calculated on the basis of the start date and duration. If you change this date, the Duration field will be modified.
The project's start and end dates are very important, because you can refer any other date in the project to these two dates. For instance, you can say that an activity starts three weeks after the start of the project. Or plan a key moment two months before the end of the project. Or plan an evaluation one year after the end of the project.
The advantage is that when for some reason you have to postpone the start of the project your whole planning will move with it (on the condition that you've used relative dates of course). This means you won't have to modify every other date manually!
On the right you can see the logo of your organisation. To include this in your Project Information window, you need to upload it using the My organisation button of the File toolbar.
You can use the various tab pages below to include additional information:
- Description: what is the project's current status; what type of project is it; in what sectors does it fit? You can also provide a narrative description of the project and of the context in which it will take place.
- Target groups: identify your different target groups, their characteristics and where they are located on a world map. Indicate which information you need to gather from your beneficiaries.
- Intervention zones: in what countries, regions or locations will you work? Identify the different zones and indicate them on a world map.
- Partners: which organisations will assist you in the project (partners, donors, suppliers…) and who are the people you are in contact with?
- Funding: who will provide funding for your project? What transactions are planned or have been made?
- Monitoring deadlines planning: this allows you to determine when and how often monitoring of results and risks should happen.
- IATI specific information: if you want to create an IATI activity file for your project, you need to complete some additional information (IATI identifier; international aid type; budget status...)
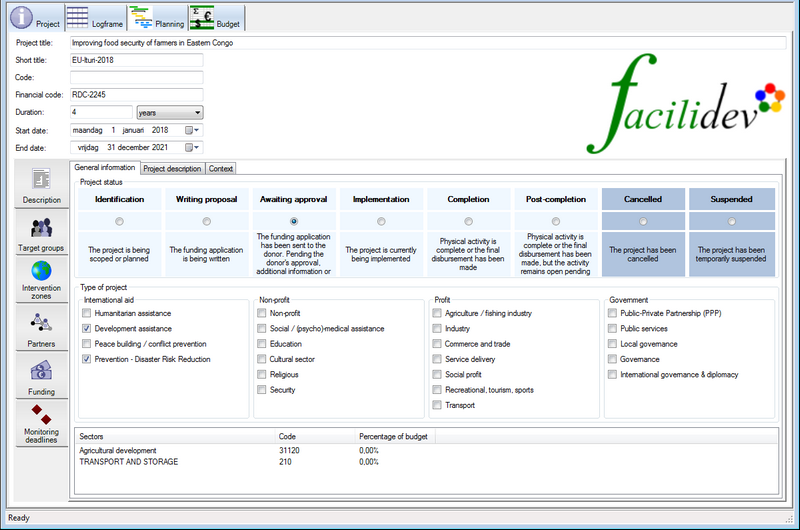
Description of the project
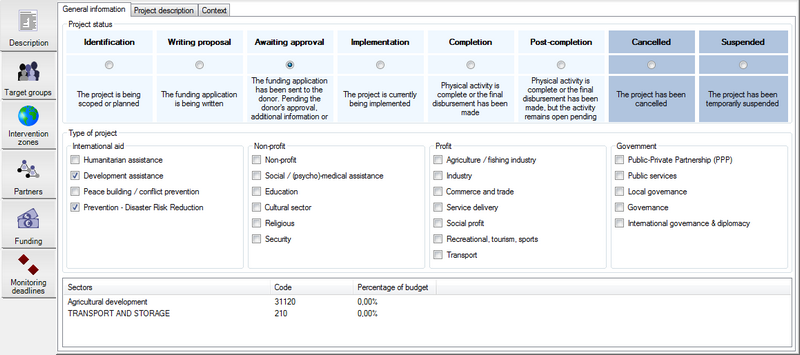
On the Project Description tab of the Project Information window you can create a resume of what the project is about.
On the General information tab you can specify the current status of the project, i.e. in which phase of the project's lifetime (Identification; Implementation; Completion; Post-completion). If you're working with donors (see Funding tab), additional phases for proposal writing and approval are included. You can also specify whether a project is suspended or in the worst case cancelled entirely.
Below you can indicate which type of project this is, according to four main categories: International aid projects; Non-profit projects; for Profit projects or Government projects. You can select more than one type if you want. If you indicate that the project is about Humanitarian assistance, you will see that an additional tab page appears next to 'Context'.
On the bottom of the first tab you can add different economic sectors. Just click in the list and then in the Items toolbar click on the Add button. By default Logframer uses the UNDP DAC (Development Assistance Committee) 5-digit codes.
On the Project description tab you can write a descriptive text about what the project is about, for instance a short introduction or if you want a longer narrative description.
Similarly on the Context tab you can describe the context in which the project will take place. By this we mean the social, economic, cultural, political... environment in which the project will take place. Generally, this text provides the reader with an understanding in why the project is necessary and how it will contribute to improve the situation in the country or areas where you will work.
Identification of your target group(s)
Logframer allows you to specify one or more target groups for each main purpose of your project. You can add target groups on two places:
- In the Project Information window, click on the Target Groups tab
- In the Logical Framework window, make sure that the Details pane is visible. If not, go to the Lay-out toolbar and click on the Show Details button. Then click on a purpose.
To add a target group, click into the list. This will select the Items toolbar. Then press the Add button. You will get the following dialogue window:
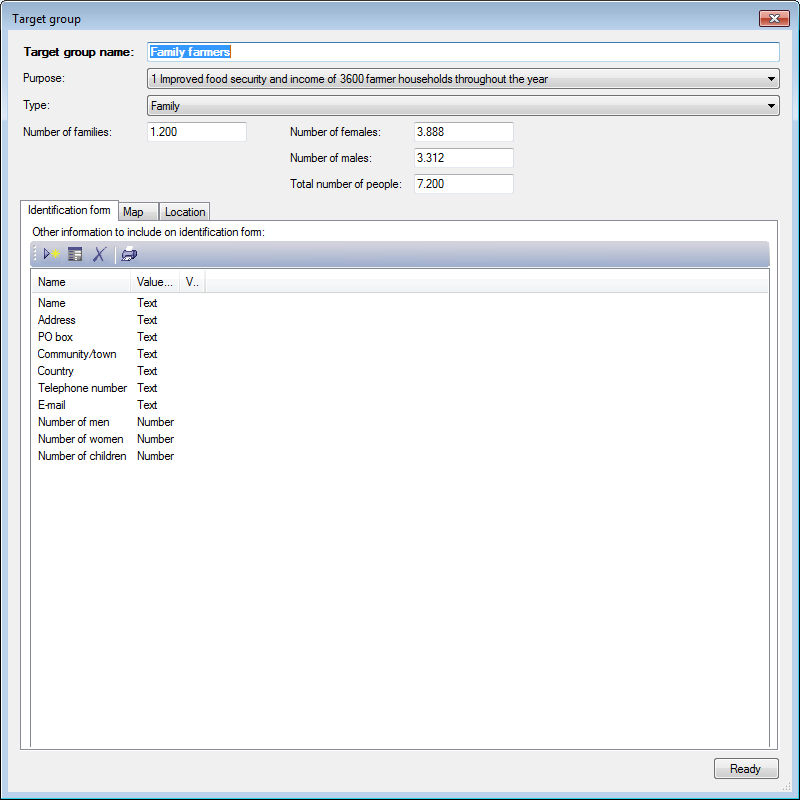
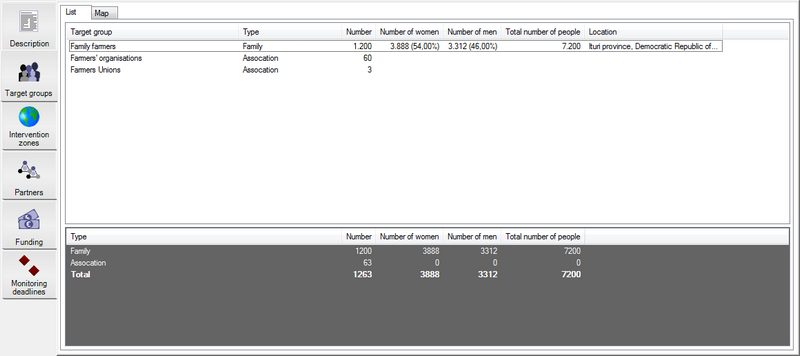
- Target group name: description of the target group
- Purpose: select the purpose to which the target group belongs. You can move a target group from one purpose to the other using this list.
- Type: are you working with individuals, families, extended families, communities, associations, enterprises, local authorities, (national/regional) authorities or other types of beneficiaries?
- Statistics: this section allows you to identify the size of the target population
- Number: the number of families, communities, associations… you expect to be working with. If you work with individuals, this number will be the same as the total number of people.
- Number of people: on the right you can specify three numbers:
- Number of women
- Number of men
- Total number of people
Below, you can specify which fields should be included in the Target Group Identification form. Depending on the type of beneficiary you choose, Logframer will include default fields such as the name of the person or organisation, the address, etc. You can remove items that you don't need and add your own (see Tools: Target Group Identification Form).
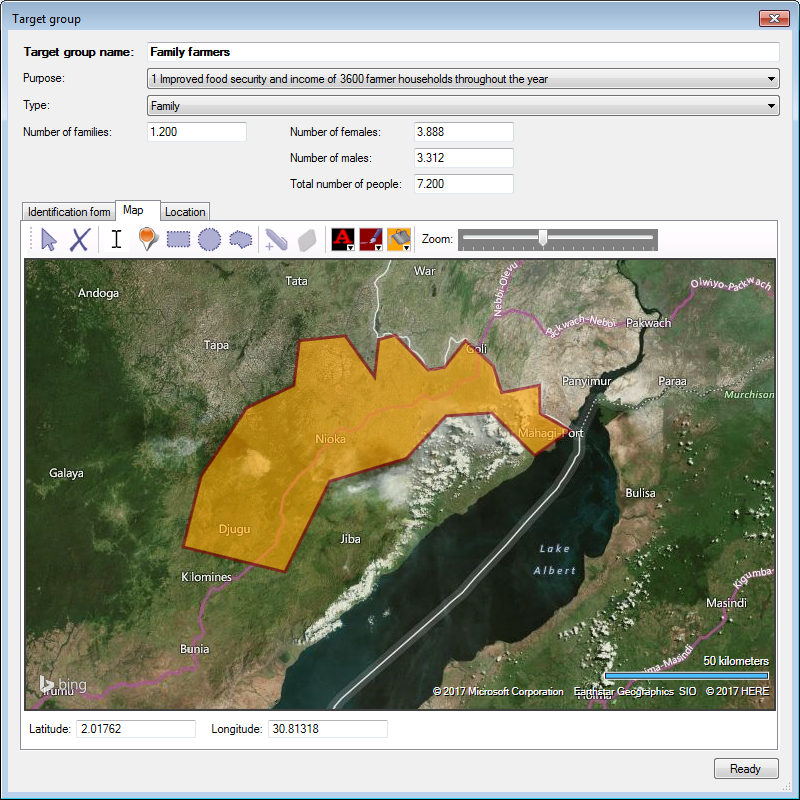
On the Map tab page, you can indicate the location of the target group on a map. You can use the different drawing tools to pinpoint individual locations, or to draw a rectangle, circle or polygon (shown here) around the area where the target group is located.
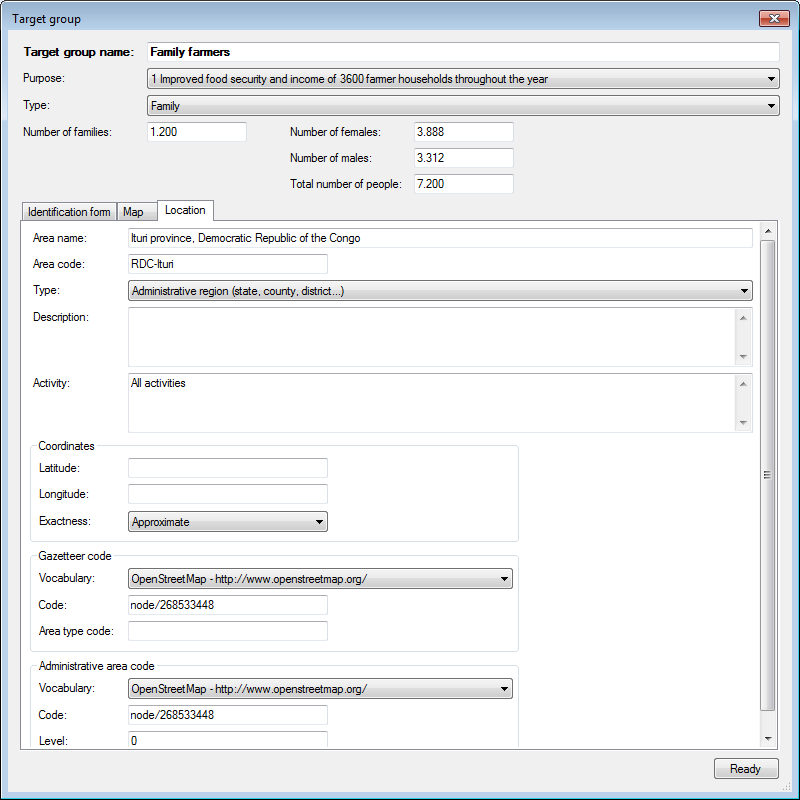
On the Location tab page, you can provide other geographic information about the location of the target group, including information that you may want to include in the IATI activity report. You can for instance add a description of the area or explain what activities you will do in this area with this target group.
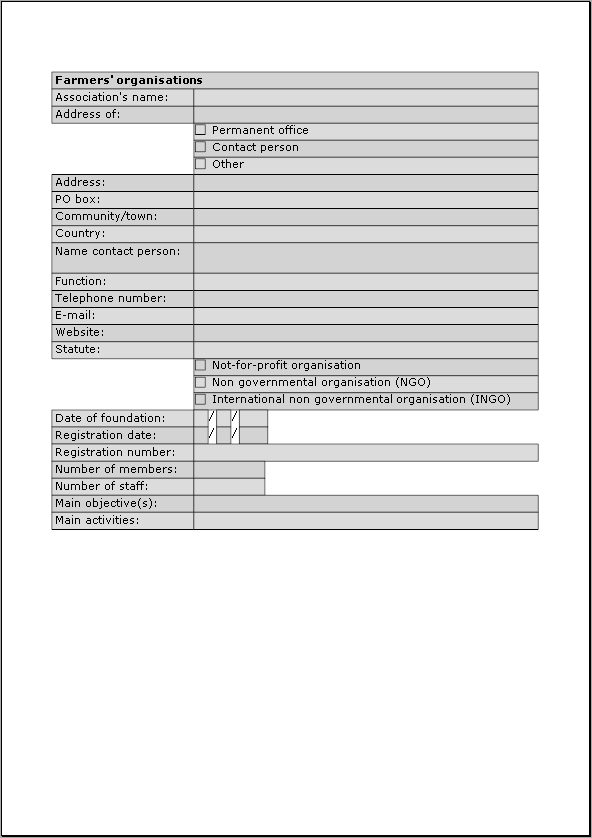
Tools: Target Group Identification Form
The Target Group Identification Form is a report that you can either print or export to MS Word. You can make a specific form for each target group.
Intervention zones
You can add one or more intervention zones to your project. You can add three types of intervention zones:
- Countries
- Regions, meaning groups of countries
- Areas: these are locations or zones on sub-national level
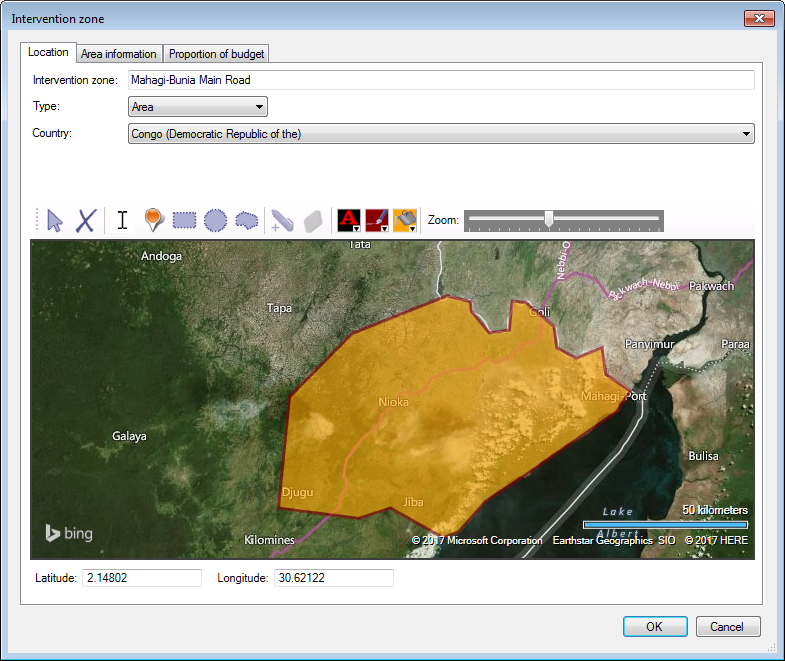
To add an intervention zone, click into the list. This will select the Items toolbar. Then press the Add button. You will get the following pop-up window:
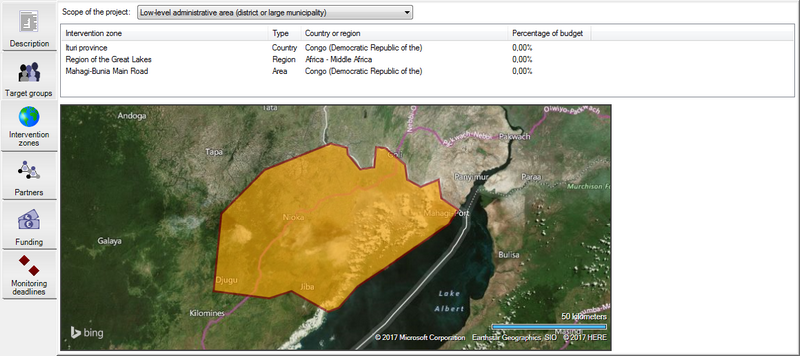
On the Location tab you can give a name to the intervention zone and select whether it is a country, a region or an area. If it is a country or region, you can select it from the drop-drown selector. On the bottom you find the map. If you select a country Logframer will automatically indicate its capital. But you can also pinpoint a location or draw a rectangle, circle or polygon around the area of your choice. If you have multiple intervention zones you will get an overview of the location of the different zones in the map of the project information window.
On the Area information tab you can include more geographical information about the intervention zone or write a short description of the IZ or about the activities that will take place (see also the location of the target groups).
On the last tab you can give an approximate indication of the proportion of the budget that will go to the intervention zone.
Who’s involved? Project partners, suppliers, donors and contacts
You can add people and organisations that are involved in your project to the list of partners and contacts. This way everyone that is involved can easily find each other's contact details.
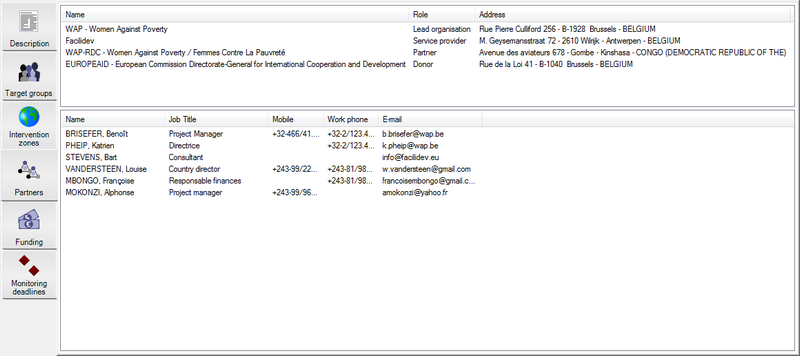
If you don't select a particular organisation, you will see the list of all your contacts below. If you do select an organisation in the top list, you will see it's details below:
To learn how you can add a new partner to your project, continue reading here.
In the bottom section, you can add:
- A short description of the organisation
- Contact information about people working for the organisation
- General contact information about the organisation's office, its website, etc.
- Indicate the location of the organisation's office on Bing Maps™
- Include financial information / donor information such as available budget lines, open calls for proposals, etc.
- IATI related information
Using the Collaboration toolbar you can quickly enter in contact with people and organisations that work on the project.
Add a new Project Partner
To add a new partner, click into the top list. This will select the Items toolbar. Then press the Add button. You will get the following pop-up window:
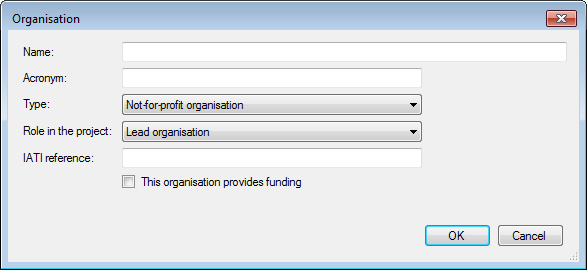
Here you can register:
- The name of the organisation (mandatory)
- The organisation's acronym
- Select the type of organisation (not-for-profit, company, medical institute…)
- The role of the organisation in the project: is it the lead organisation, a (implementing) partner, a donor, a supplier, an auditor…
- If the organisation has a IATI identifier (International Aid Transparency Initiative) then you can register it as well
- Whether the organisation provides funding or not. If you indicate that it does, you will be able to include additional information such as budget lines, calls for proposals, etc.
Click OK to add the organisation to your partner list. When you return to the main window you can add the organisation's address(es), telephone numbers, (general) e-mail address, website, contacts, etc.
Description and role of the organisation
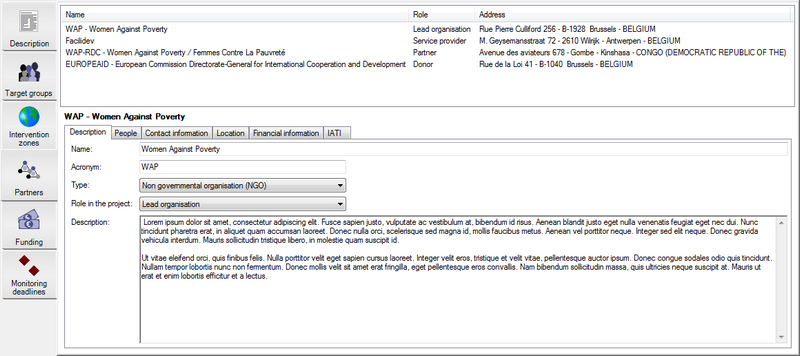
When you click on the name of an organisation in the top list, you will see its detailed information in the bottom.
On the Description tab you can modify the organisation's name and acronym, it's role in the project and provide a short description of the organisation.
Add a new contact
When you click on the name of an organisation in the top list, you will see its detailed information in the bottom.
On the Contacts tab you add people or see their details. To add a contact click in the list and then press on the Add button in the Items toolbar. This will open the following pop-up window:
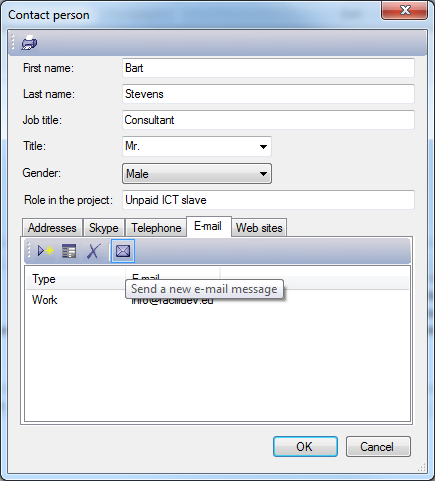
Here you can add personal contact information, such as:
- Mail addresses
- Skype account
- Telephone numbers
- E-mail addresses
- Web pages
The toolbar above this information allows you to create a new e-mail message or start up a Skype conversation (see also the Collaboration toolbar).
For IATI activity reports, the contact information of the people in your list will not be included by default. If you do want a person to be included as a contact person in an IATI report, go to the IATI tab and check the 'Include this contact in the IATI report' box.
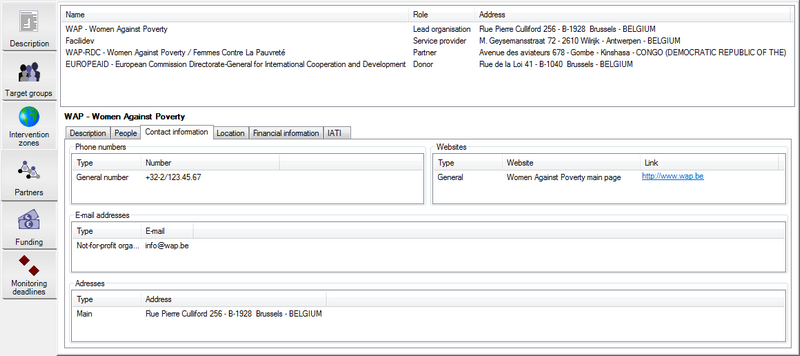
General contact information
When you click on the name of an organisation in the top list, you will see its detailed information in the bottom.
On the Contact information tab you can add:
- Mail addresses
- Telephone numbers
- E-mail addresses
- Web pages
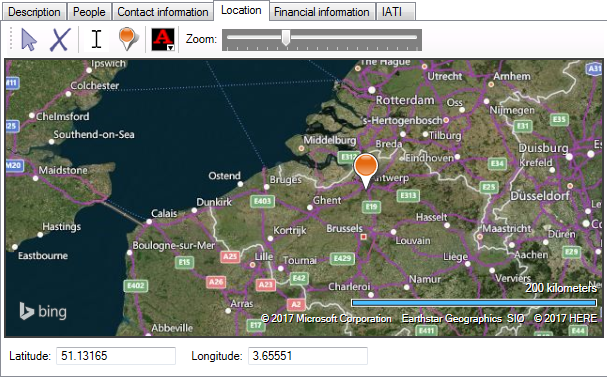
Location of the office(s)
When you click on the name of an organisation in the top list, you will see its detailed information in the bottom.
On the Location tab you can indicate the precise location of the organisation's offices on a map. You can only pinpoint the location, you cannot indicate an area on this map like you would for a target group.
Donor information and financial info
When you click on the name of an organisation in the top list, you will see its detailed information in the bottom.
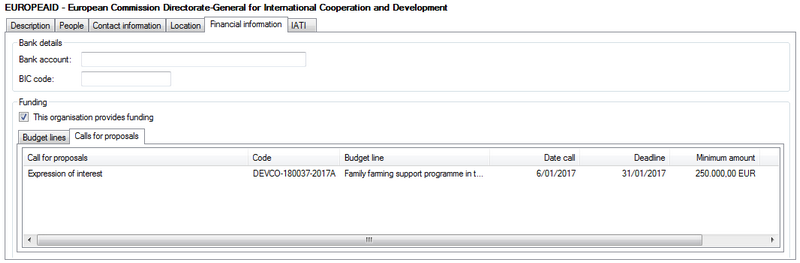
On the Financial information tab you can register bank details if you want. You can also indicate whether this organisation provides funding (if you haven't done so already when adding the organisation to your project).
If the organisation provides funding, you can add budget lines and calls for proposals (CfP-s). You can use this information later in the Funding tab.
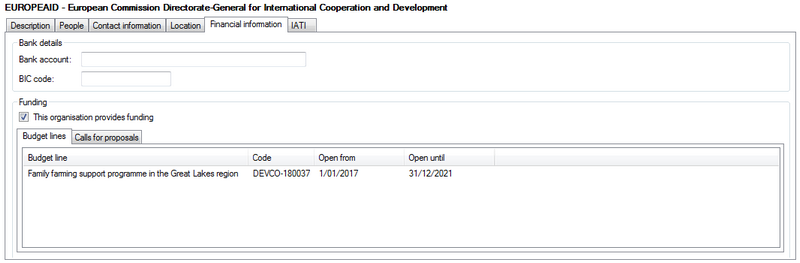
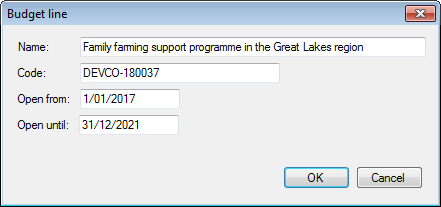
To add a new budget line, click into the list. This will select the Items toolbar. Then press the Add button. You will get the following pop-up window:
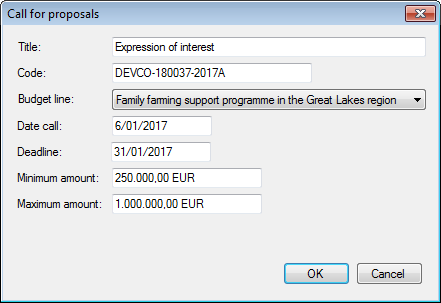
To add a call for proposals, choose the second tab and click into the list.
Then press the Add button. You will get the following pop-up window:
IATI information
When you click on the name of an organisation in the top list, you will see its detailed information in the bottom.
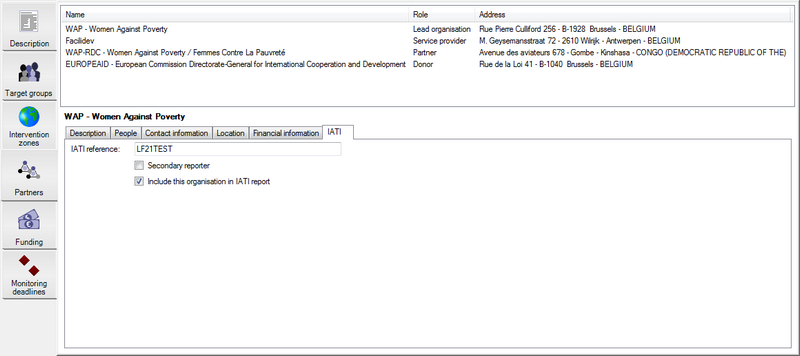
On the IATI tab you can register the organisation's unique IATI identifier code if you know it. For each partner you can choose whether you want to include this organisation in the IATI report.
If you produce an IATI activity file about a project, you can do so as the primary reporter. This means that the file will be published with your own organisation's reference as the author of the document. But you can also report on a project if you are not the lead organisation but a secondary reporter. In this case you should check the 'Secondary reporter' box.
Funding sources and transactions
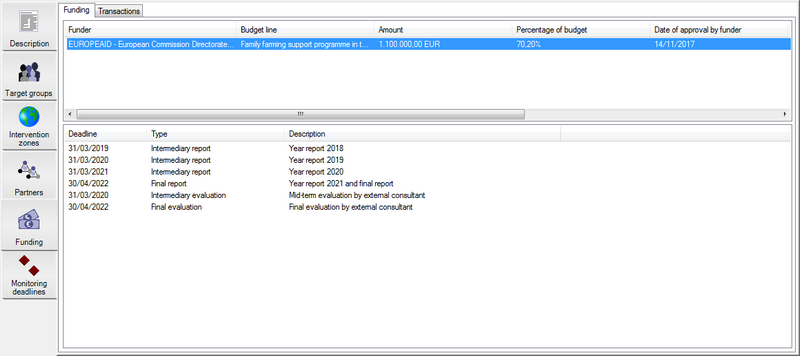
On the Funding tab of the Project Information window you can include information about your funding sources; list important contractual obligations in terms of reporting, auditing, etc. and create an overview of different financial transactions.
Before you can add funding sources, you need to have funders, i.e. organisations that provide funding. If you haven't included donors or other financial providers in your list of partners yet, you have to do this first.
To add a funding source, click into the list. This will select the Items toolbar. Then press the Add button. You will get the following pop-up window:
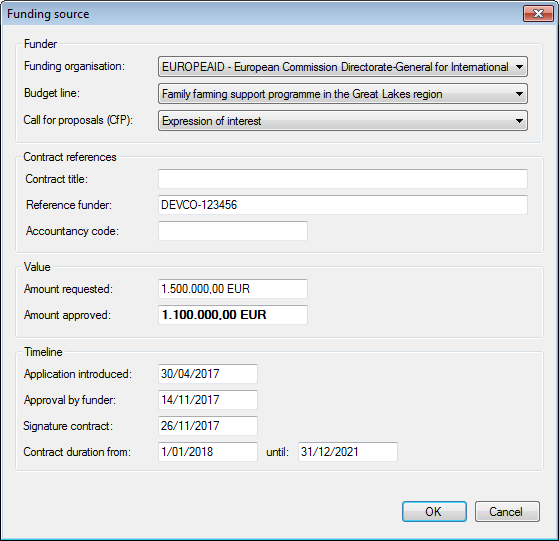
- In the first drop-down list you have to select the funding organisation. Next you can select a budget line and indicate the call for proposals if you want (you need to add the available options to the funding organisation's information first).
- In the section below you can add information about the contract with the funder, such as the title of the contract or the contract number.
- Next you can indicate the value of the contract (and how much you've requested initially).
- The final section contains important dates such as the date of approval and the actual duration of the contract.
Once you've added a funding source, you can add contractual deadlines that you have to respect, such as the dates of intermediary and final reporting; audits and evaluations; etc.
Contractual obligations (deadlines)
For each funding source in the top list, you can add contractual deadlines. These include things like intermediary and final reports, financial reports, evaluations and audits.
To add a contract date, click into the bottom list. This will select the Items toolbar. Then press the Add button. You will get the following pop-up window:
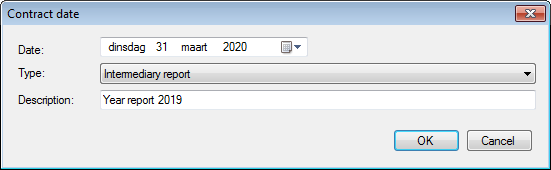
Here you can set the deadline, select the type of contractual obligation and give a short description.
Transactions
Transactions are transfers of funds from one partner organisation to another. There are two main types of transactions: planned transactions and actual transactions.
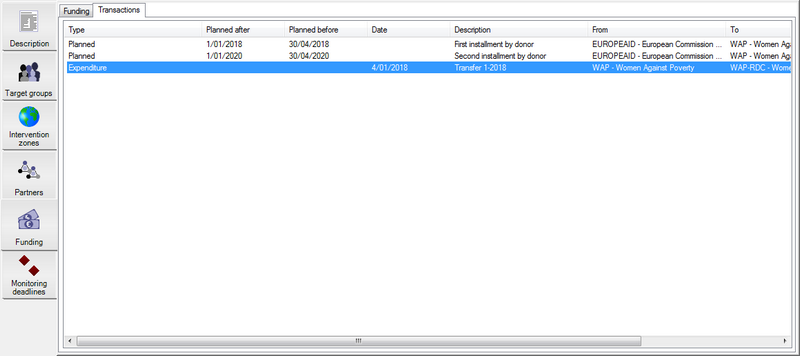
To add a transaction, click into the list on the Transactions tab. This will select the Items toolbar. Then press the Add button. You will get the following pop-up window:
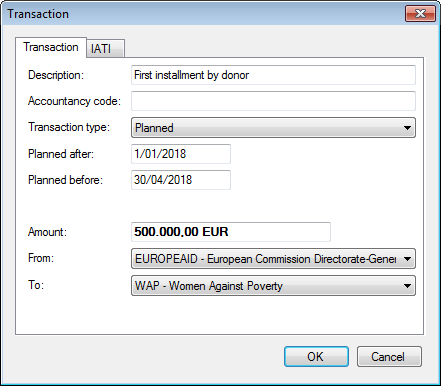
To make this a planned transaction, choose 'Planned' from the Transaction type list. You will then be able to determine in which period the transaction will take place. Below, you can indicate the (approximate) amount of the planned transaction and the partner organisations that will make and receive the transaction.
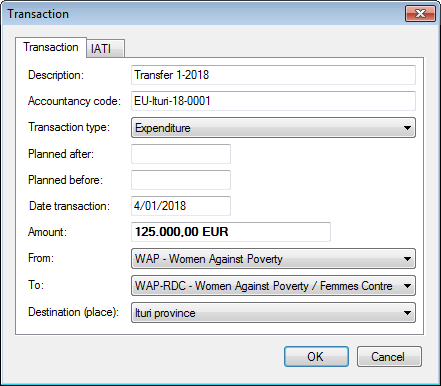
For actual transactions, you can also click in the list and then press the Add button to open the same window. You can either have a completely new transaction, or change the Transaction type from 'Planned' to any of the following options:
- Incoming funds (for instance when you received a payment from a donor)
- Disbursement (for instance when you transfer money from the main project account to the account of a partner organisation or a local office)
- Expenditure (when you actually buy something or pay for services)
- Interest repayment
- Loan repayment
- Reimbursement
- Purchase of equity
- Sale of equity
- Credit guarantee
- Incoming commitment
In most cases you will use the first three. The idea here is not to list every single small purchase, but to focus on the transfer of important sums. In other words, this is not meant to do (or replace) your accountancy but to enhance transparency. Transactions are therefore very important in the framework of the International Aid Transparency Initiative (IATI).
IATI and transactions
Transactions are central to the idea of international aid transparency. If you want to create an IATI activity file of your project, it is important that you pay sufficient attention to transactions. Overall, the idea behind IATI is that you can trace the money that donor countries give to recipient countries through transactions. Transactions allow people to see how money flows from one organisation (agency) to the other until it finally arrives in the recipient countries and is spent in the form of investments, delivery of goods and services, provision of credits, etc.
If you want to support the IATI initiative you have to make sure that the transactions that you include in your project file make it clear how the money you received from various sources makes it way to the target groups/beneficiaries it is intended for. IATI asks you to provide certain information for each individual transaction. You must provide this information on the IATI tab of the pop-up dialogue:
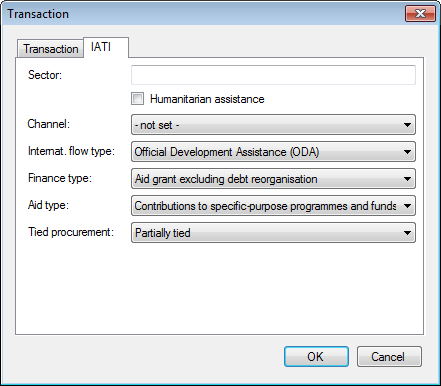
This image shows the default settings of Logframer for individual transactions. They are optimised for aid delivery by Non Governmental Organisations:
- Official Development Assistance
- via aid grants (donor grants)
- implemented through projects or programmes that have a specific purpose (specific objective/outcome)
- expenses are made through partially tied procurement, which generally means that for expenses above a certain amount you need to follow a procurement procedure inviting suppliers to make offers and then make a selection based on open criteria (organise a market).
On top you can enter the code of the Sector for which this transaction is destined, although a typical NGO project will focus on one specific sector, which you can also indicate in the Project Description. You can indicate whether this transaction concerns humanitarian assistance - again something that you can also indicate in the Project Description. The Channel field is more suited for assistance from one government to the other (not set by default).
Setting monitoring deadlines
Before you start detailing your indicators, it's best to set the monitoring deadlines first. When you design your logframe, you can add indicators and verification sources. But before you start to specify the details of the indicators (question type, value range, baseline and targets…) it's best to set these deadlines first.
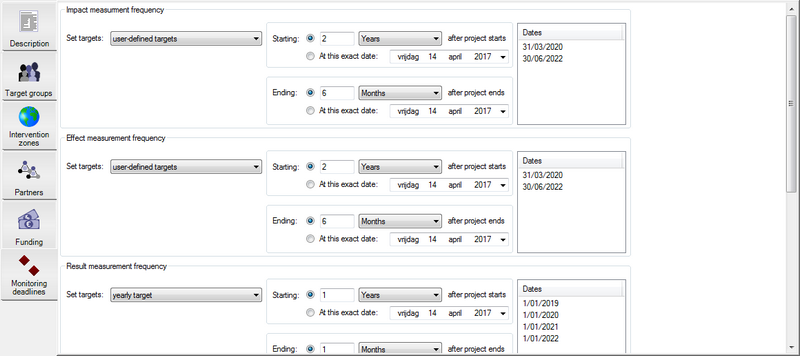
For each level of the logframe (goals, purposes, outputs and activities) you can specify when and how often the indicators will be measured. For indicators that use values or scores, this means that you can set targets.
You can set:
- A single target: if you want to achieve a single target by the end of the project
- A yearly target: you can specify a target for each year of the project. If the project runs 3 years from 2017 until 2019, you will be able to specify 3 targets
- A twice yearly target: specify a target for each 6-month period
- A quarterly target: specify a target for each 3-month period
- A monthly target: specify a target for each month
- User defined targets: if the previous options are not convenient, you can specify the exact dates on which you want to measure the indicators
Depending on the type of project you design and the level in the logframe, you will want the frequency to be higher or lower. Emergency aid projects may need monthly follow-up; development projects typically use yearly or twice yearly targets. You may want to monitor your outputs yearly (or more regularly) but the indicators of the project's purpose and impact only at the end of the project.
These settings do not affect the baseline: for each indicator you can set the baseline.
After setting the frequency of the monitoring, you can choose when it will start and end. You can choose a date relative to the start or end date of the project, or you can specify a fixed date. Based on your preferences, Logframer will generate a list of the monitoring dates in the overview on the right.
IATI specific project settings
The IATI specific information tab is only visible when you set the view mode to IATI activity or IATI organisation view mode. Use this if you want to create an IATI activity file from your project.
- On this tab you can register the unique IATI identifier code for your project, which must be included in each IATI file. Beneath you can list relations with other projects.
- On the second tab you can provide more information about the type of international aid this project is about.
- Finally you can include document links to related documents available on your website.
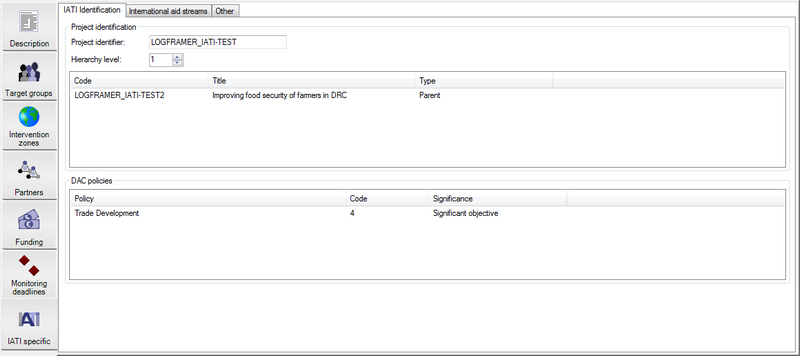
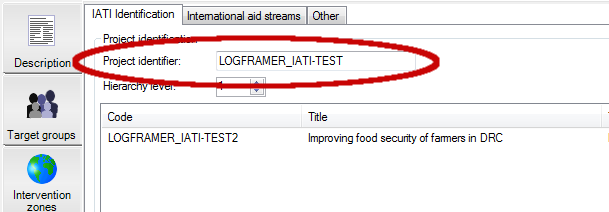
IATI identification
If you want to publish the information of your project as an IATI activity file, you have to get a valid IATI identifier. Once you have this code, you must enter it in the Project identifier field:
The hierarchy level is used for complex programmes to indicate at what level this current project is situated. For instance, you may have a regional programme for West-Africa (hierarchy level 1) with sub-programmes for Senegal and Guinea (hierarchy level 2). How you structure your programme (hierarchy) is up to you.
Next you can list the programmes to which this particular project is linked. To do so, click in the top list and press the Add button in the Items toolbar.
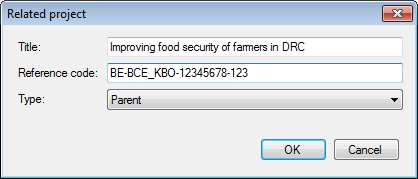
In this dialogue window, you can provide the title of the related programme, its specific IATI indicator code and the type of relationship it has (parent project, child project, sibling project, co-funded project or third party project).
In the bottom list, IATI asks you to indicate to which DAC (Development Assistance Committee of the OECD) policies your project makes a contribution. Click in the bottom list and press the Add button in the Items toolbar to create a new item.
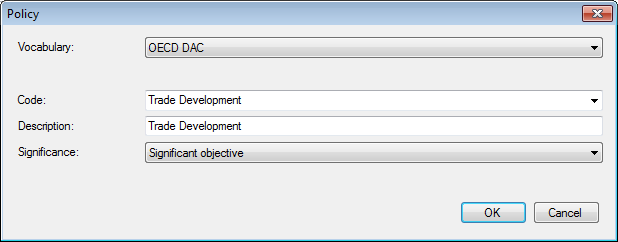
The DAC policies your project can contribute to are:
- Gender equality
- Aid to environment
- Participatory Development/Good Governance
- Trade Development
- Aid Targeting the Objectives of the Convention on Biological Diversity
- Aid Targeting the Objectives of the Framework Convention on Climate Change - Mitigation
- Aid Targeting the Objectives of the Framework Convention on Climate Change - Adaptation
- Aid Targeting the Objectives of the Convention to Combat Desertification
- Reproductive, Maternal, Newborn and Child Health (RMNCH)
For each topic you select, you can indicate how significant it is for your project:
- Not targeted
- Significant objective
- Principal objective
- Principal objective AND in support of an action programme(desertification-related aid only)
- Explicit primary objective
International aid streams
On the International aid streams tab, you need to indicate under what type of aid your project falls (see also Transactions where you can specify this for every financial transaction you make). The default settings of Logframer (shown before) are optimised for aid delivery by Non Governmental Organisations:
- Bilateral funding
- Official Development Assistance
- via aid grants (donor grants)
- implemented through projects or programmes that have a specific purpose (specific objective/outcome)
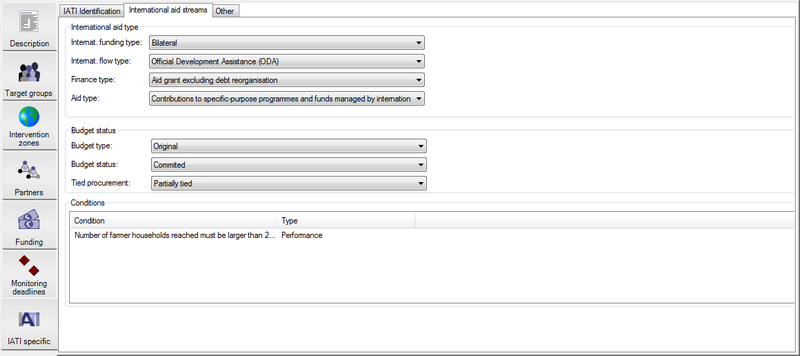
Below you can indicate the status of your financial figures: is this the original budget? Is the budget already committed or just indicative? Are procurements dependent on a tied procedure, a partially tied procedure or untied?
Finally you can list any conditions that may apply to the project as a whole. These conditions may be imposed from a certain policy or can be financial or performance related.
Document links
Once your IATI activity or organisation file is ready, you have to publish it on your website and register it in the IATI registry. But there may be other documents that are relevant to your project. You can also publish these on your website and indicate their specific location in the Document links table.
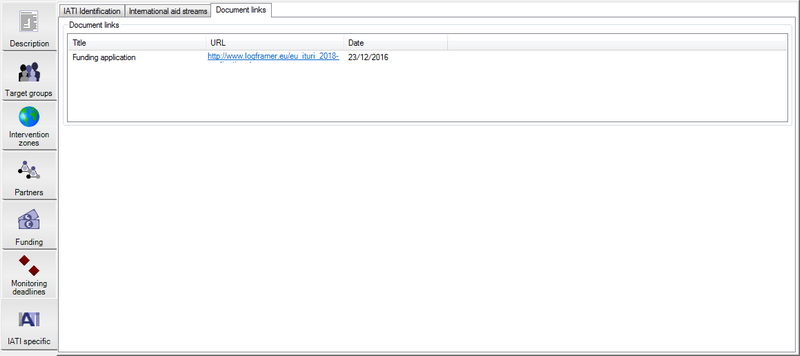
To add a document link, click into the list. This will select the Items toolbar. Then press the Add button. You will get the following pop-up window:
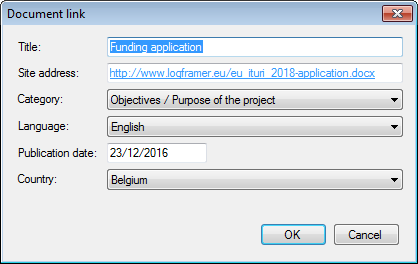
Here you can provide the title of the document and its location on your website (or another publicly accessible site). It's also important to indicate the language of the document. This also means you can include multiple versions of the same document in different languages for instance.
Working with the logframe, planning and budget
When you design a project, the starting point is the Logical Framework window. Once you have identified your project's logic, how the working environment may influence your project (risks, assumptions, dependencies) and how you will keep track of your project, you can start detailing your planning and budget.
The Logical Framework window, the Planning window and the Budget window have a similar set-up: the main window contains the logframe, planning or budget. If you press <Ctrl><D> (or use the Show Details button in the Lay-out toolbar) you will get the Details pane in the bottom part of the window.
If you want to create an IATI organisation file (by setting the view mode to IATI organisation), you will see an additional Expenses window. This works entirely the same as the Budget window.
The main window contains the grid of the logframe, planning or budget. In this grid you can:
- Enter text in text fields (all fields of the logframe, second column of the planning and budget) and use the Text toolbar to turn text bold or italic, change the typeface and size, change the text or background colour, etc.
- Move items around: different types of items in Logframer are linked to each other in a specific and hierarchical way. Your project's outcome can have different outputs and each output can have several activities for instance. If you move an output or activity, its child items (indicators, resources, risks...) will move with it - or not if you don't want them to. Don't worry about numbering items, Logframer will do all that for you.
- Copy and paste items: because of the relationships between items, you can copy an item with all its child items - or not if you don't want to.
- Change the lay-out of your logframe/planning/budget: you can make different versions of your logical framework, planning or budget and print them or export them to MS Word or Excel. Use the Lay-out toolbar to change the appearance or to focus on a particular part you're working on.
In this section you will learn how to work with the logframe, planning and budget and how to modify their appearance. For more control over colours and typefaces of titles etc. see the topic about the Logframer settings.
Working with the logframe
To design the logical framework of your project, select the Logframe tab.
The Logical Framework window allows you to design the logframe of course, but using the Details pane you can also add additional information. This in turn will allow you to design specific tools:
|
Main window |
Details pane |
Tools |
|
Goals |
Project information (1) |
|
|
|
List of partners (1) |
List of partner organisations for project documentation |
|
Purposes |
Target groups (1) |
|
|
Outputs |
Key Moments (2) |
|
|
Processes, activities & sub-activities |
Preparation and follow-up periods (2) |
|
|
|
Repeating activities (2) |
|
|
Indicators and sub-indicators |
17 different types of indicators |
Monitoring tool in Excel |
|
|
Targets and scores |
|
|
|
Statements and responses |
Questionnaires / indicator lists |
|
|
Value ranges |
|
|
Verification sources |
|
Included in Performance Measurement Framework |
|
Risks, assumptions and dependencies |
Detailed information according to RAID typology |
|
|
|
|
|
|
Resources |
References to specific budget items and % used for that particular resource |
(1) You can also do this in the Project Information window
(2) You can also do this in the Planning window. In the Details pane of the logframe you can modify dates, durations and so on, but in the Planning window you have drag-and-drop functionality
Logframe items
The logical framework allows you to design the structure of your project, containing the following logframe items:
- Project logic items are arranged in the first column, in four sections:
- Goals (top section) or long term objectives: these are the broad objectives on the level of the (local) society that your project contributes to. This means you don't expect them to be achieved entirely by your project, but it will help advance the local society towards these objectives. As such, this means you don't have these objectives fully under your control.
- Purposes: a purpose explains why your project exists in the first place. It is the main objective of your project, which you hope to achieve by its completion (medium-term objective). It is often recommended to have no more than a single purpose in your project, but Logframer can handle more than one purpose. If you do have more than one purpose, your outputs and activities will be grouped per purpose.
- Outputs: these are the direct and tangible results of the activities and processes of the project. For each purpose, you can have as many outputs as you want.
- Activities: to achieve each output, you can include one or more activities designed to create this output. You can even split up larger processes (activities) into sub-activities (or smaller processes split up into sub-sub-activities and so on).
- Indicators are listed in the second column. For each objective (goal, purpose, output) or activity you can identify as many indicators as you want. Indicators can also have sub-indicators (and sub-sub-indicators etc.) You can design indicators to follow up each type of objective:
- Impact indicators to follow the evolution of the goals
- Effect indicators to follow up the progress towards the purpose(s)
- Output indicators to follow up the delivery of outputs
- Process indicators to follow up the progress of activities and processes
- Verification sources are listed in the third column. For each indicator you can include one or more verification sources
- Risks, assumptions and dependencies are listed in the fourth column. For each objective you can list as many risks, assumptions and dependencies as you want
- Resources are only available in the Activities section at the bottom. Here you can switch the view from listing indicators and verification sources for each activity, or the resources and budget. For every (sub-)activity you can list as many resources as you want. In the Budget column of the logframe (bottom of the Verification Sources column) you can specify an indicative total for the resources. Alternatively, you can calculate this amount by selecting items from the budget.
Parent-child relations
Logframe items are linked to each other in two ways:
- Purposes, outputs and activities are vertically linked to each other (vertical logic): each purpose can have several outputs, each output can have several activities and each activity (process) can have several sub-activities (and so on). Each indicator can also have several sub-indicators (and sub-sub-indicators and sub-sub-sub-indicators and so on).
- Objectives or activities can have several indicators and several risks/assumptions/dependencies. Each indicator can have several verification sources. This is the horizontal logic.
When you move items around, Logframer will make sure the vertical and horizontal logic remains intact. This means for instance that when you drag output 2 before output 1, that in the bottom section the activities of output 2 will also be placed before the activities of output 1.
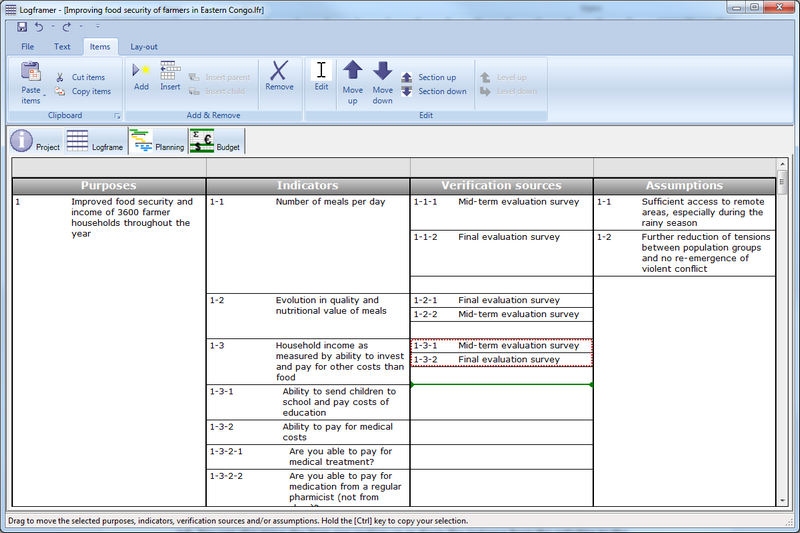
When you move an indicator that has several verification sources and you only select the indicator itself, the verification sources will remain in place and you will see a place-holder text.
Adding items and working with text
To add an item, simply click in an empty box and start to type. At the bottom of each section in each column you will always find an empty text box. If these empty boxes are not visible, select the Lay-out toolbar and click on the Show empty cells button in the View section.
You can edit the text like you would in any word processor using the Text toolbar. You can change the typeface or size, make text bold, underlined, etc. and align the text to the left, right or centre.
If you want to change the appearance of all text in the logframe, or all the text in the Indicators column for instance, use the text selection options to select multiple cells and then modify the text to your liking.
Moving items around
You can move a single item or a group of items from one section to the other or from one column to the other, or simply change the order that the items are displayed.
To select a single item, click on it with the left mouse button. To select more than one item, press the left mouse button and drag. The red selection rectangle will expand to include other cells, but you can only select cells within a single section.
To move items, press the right mouse button within your selection (red selection rectangle) and drag it to the place where you want to insert the items. A green indicator line will appear and show the current location. When you come close to the top or bottom border of the logframe, it will scroll up or down. Release the right mouse button to insert the items you selected.
Another way to move items is to use the Move Up and Move Down buttons in the Items toolbar. You can also move the item one section up or down (for instance from the activities to the outputs section).
Copying and pasting items
You can cut, copy and paste items in three different ways. First select the items you want to cut or copy (see ‘Moving items around’).
- Use the Cut, Copy and Paste buttons of the Items ribbon tab.
- Press Ctrl+X to cut; Ctrl+C to copy and Ctrl+V to paste
- Right click into the red selection rectangle and move the green indicator line to where you want to copy the item(s) (see ‘Moving items around’). But this time hold the Ctrl button when you release the right mouse button. This will copy the selected item(s) instead of cutting and pasting them.
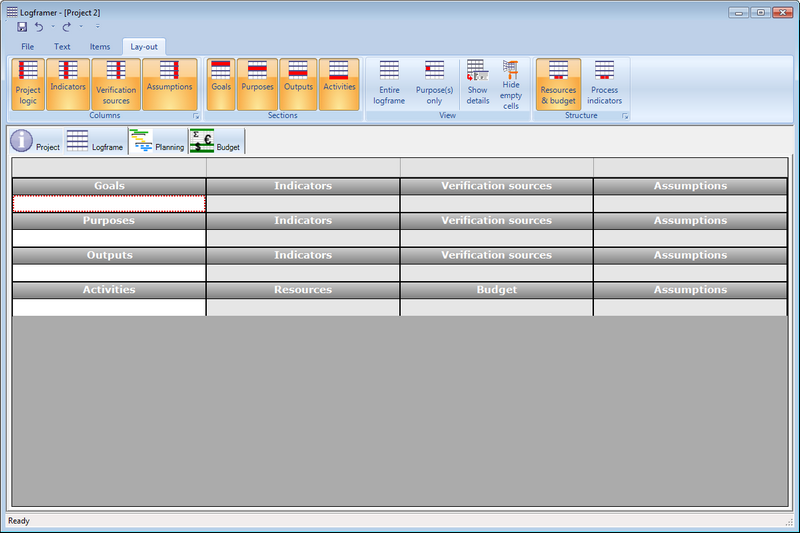
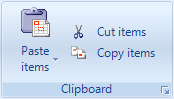
Changing the lay-out of the logframe
Using the Lay-out toolbar, you can hide columns and sections; hide everything but your project's main purpose(s); switch between viewing the process indicators or the resources; and show or hide the Details pane.
This enables you to make custom versions of the logframe, which you can then print or export to MS Word or MS Excel. It also allows you to hide the columns or sections that you are not working, making it easier to focus.
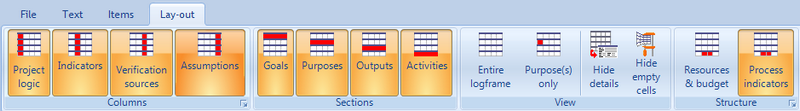
The Lay-out toolbar has the following ribbon panels and buttons:
- Columns ribbon panel: hide or show the Indicators, Verification Sources and/or Assumptions column. The Project Logic column will always remain visible, but if you click this button the three other columns will hide or show.
- Sections ribbon panel: hide or show the Goals section, the Purposes section, the Outputs section and/or the Activities section
- View ribbon panel:
- Show the entire logframe
- Show the project's main purpose(s) only
- Hide or show the Details pane at the bottom of the screen
- Hide empty cells: click this button to hide the empty cells at the bottom of each group of items. This will make the view of the logframe more compact. You can still insert or add items using the Items ribbon.
- Structure ribbon panel: in the Activities section (bottom section of the logframe), you can choose between viewing process indicators and their verification sources (columns 2 and 3), or the resources and (estimated) cost necessary for each activity.
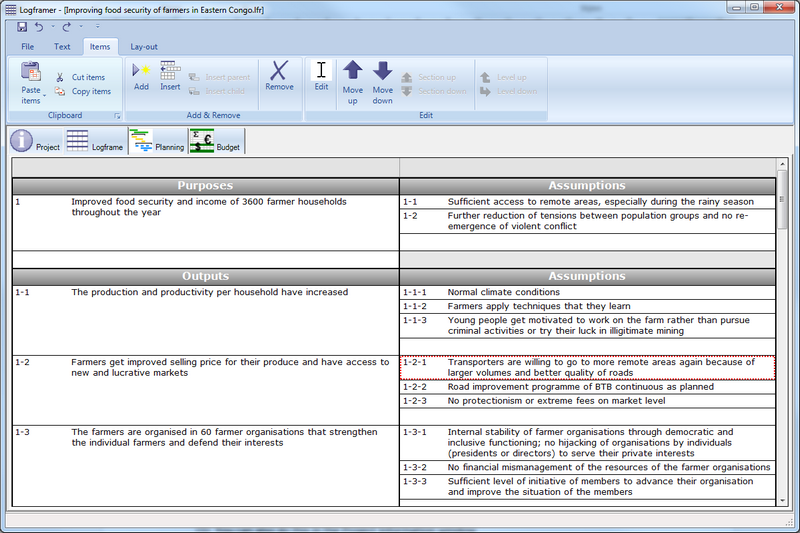
Tools: the logical framework
You can print the logical framework, export it to MS Word or to MS Excel. When you print or export the logframe, you can customise its appearance:
- You can show or hide columns
- You can show or hide sections (goals, purposes, outputs, activities)
- In the activities section, you can choose between showing the performance indicators and their verification sources, or the resources and budget necessary for each activity.
This way you can easily produce different versions of the logframe for your funding applications, for training purposes, for communication purposes, for project management, etc.
Working with the planning
To design the planning of your project, select the Planning tab.
The Planning window allows you to plan the project's key moments, processes and activities. Using the Details pane you can also specify additional information. This in turn will allow you to design specific tools:
|
Main window |
Details pane |
Tools |
|
Key moments |
Relation of key moment to other key moments or activities (1) |
|
|
Processes |
Who organises and where (1) |
|
|
|
Child activities (1) |
|
|
Activities & sub-activities |
Relation of activity to other key moments or activities (1) |
|
|
|
Duration of activity (1) |
|
|
|
Who organises and where (1) |
|
|
|
Preparation and follow-up periods (1) |
|
|
|
Repeating activities (1) |
|
(1) You can also do this in the Logframe window. In the Details pane of the logframe you can modify dates, durations and so on, but in the Planning window you have drag-and-drop functionality.
Planning items
The planning window allows you to plan the different activities and key moments (milestones) of your project. It contains the following items:
- Key moments such as deadlines, milestones, external events, etc.
- Processes, which consist of several activities
- Activities, which can exist on their own or as part of a larger process. If you add sub-activities to a parent activity, it becomes a process.
Activities, processes and key moments are grouped per output of your logical framework. Key moments are always ordered by date.
Parent-child relations
Planning items are linked to each other in two ways:
- Outputs and key moments are vertically linked to each other (vertical logic): each output can have several key moments
- Outputs and activities are vertically linked to each other (vertical logic): each output can have several activities
- Each activity (process) can have several sub-activities (and so on)
When you move items around, Logframer will make sure the vertical logic remains intact. This means for instance that when you drag output 2 before output 1, that the key moments and activities of output 2 will also be placed before those of output 1.
Adding items and working with text
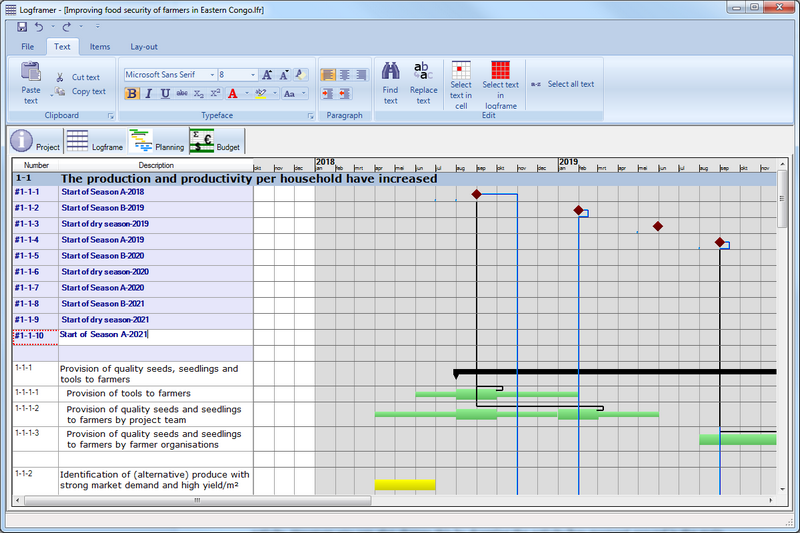
For each output, there are two sections in the main planning window. Directly below the output you can enter key moments in the blue section. If this blue section is not visible, go to the Lay-out toolbar and in the Items section click on the Key moments button.
Below the blue key items section in the planning is the activities section (in white). To add an activity, simply start typing in an empty cell. If the white activities section is not visible, go to the Lay-out toolbar and in the Items section click on the Activities button.
You can edit the text of the activities and processes like you would in any word processor using the Text ribbon tab. You can change the typeface or size, make text bold, underlined... and align the text to the left, right or centre.
You can't change the typeface etc. of the key moments.
Moving items around
You can move a key moment to another output. But you can't change the order of the key moments of a certain output because they are ordered according to date.
You can change the order of the activities of an output and drag activities from one output to the other.
To select a single item, click on it with the left mouse button. To select more than one item, press the left mouse button and drag. The red selection rectangle will expand to include other cells, but you can only select cells within a single section.
To move items, press the right mouse button within your selection (red selection rectangle) and drag it to the place where you want to insert the items. A green indicator line will appear and show the current location. When you come close to the top or bottom border of the logframe, it will scroll up or down. Release the right mouse button to insert the items you selected.
Another way to move items is to use the Move Up and Move Down buttons in the Lay-out ribbon tab (only enabled for activities, not for key moments). You can also move the item one section up or down (from one output to the other).
Copying and pasting planning items
You can cut, copy and paste items in three different ways. First select the items you want to copy paste (see ‘Moving items around’).
- Use the Cut, Copy and Paste buttons of the Items ribbon tab.
- Press Ctrl+X to cut; Ctrl+C to copy and Ctrl+V to paste
- Right click into the red selection rectangle and move the green indicator line to where you want to copy the item(s) (see ‘Moving items around’). But this time hold the Ctrl button when you release the right mouse button. This will copy the selected item(s) instead of cutting and pasting them.
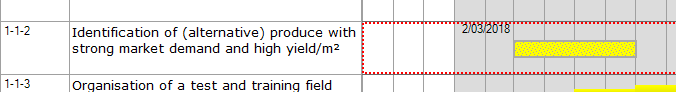
Dragging to change start, end and duration of activities and key moments
You can use the Details pane to specify the date of a key moment or the start date and duration of an activity. However you can also change this by dragging the activity/key moment around in the main window.
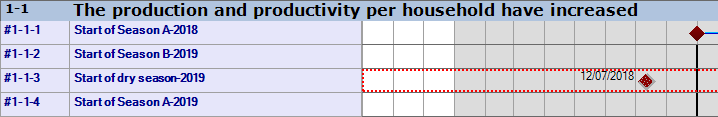
Key moments:
- Click and hold the key moment with the left mouse button. Drag it in the direction of the date you want to place it. You will see a date appearing next to the key moments symbol (the red diamond shape), allowing you to release it exactly on the right date.
- Notice that the key moments are listed according to date. So if your key moment comes before or after other key moments, it will change its place in the list (going up or down in the list).
Activities:
- To change the starting date of the activity: click and hold the left side of the activity bar and then drag it in the direction of the date you want to place it. You will see a date appearing next to the activity bar, allowing you to release it exactly on the right date. This operation will not change the duration of the activity
- To change the end date of the activity: click and hold the right side of the activity bar and then drag it in the direction of the date you want to place it. You will see a date appearing next to the activity bar, allowing you to release it exactly on the right date. This operation will change the duration of the activity.
- To move the activity without changing the duration: click and hold somewhere inside the activity bar and then drag it in the direction of the date you want to place it. You will see two dates appearing next to start and end of the activity bar, allowing you to release it exactly on the right date. This operation will not change the duration of the activity.
- A shorter/longer preparation period: click and hold the left side of the thin preparation bar before the activity and then drag it in the direction of the date you want to place it. You will see a date appearing next to the preparation bar, allowing you to release it exactly on the right date. This operation will change the duration of the preparation period but will not change the start date or duration of the activity.
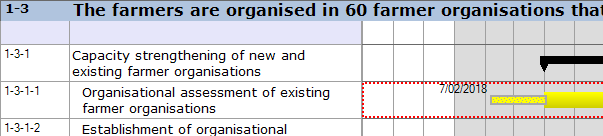
- A shorter/longer follow-up period: click and hold the right side of the thin follow-up bar on the right side of the activity and then drag it in the direction of the date you want to place it. You will see a date appearing next to the follow-up bar, allowing you to release it exactly on the right date. This operation will change the duration of the follow-up period but will not change the start date or duration of the activity.
Changing the lay-out of the planning
Using the Lay-out toolbar, you can hide certain columns; hide or show key moments and/or activities; select the level of detail of the Gantt chart; hide or show links between key moments and activities; and show or hide the Details pane.
The Lay-out toolbar has the following ribbon panels and buttons:
- Columns ribbon panel: hide or show the Dates column. The Descriptions column will always remain visible.
- Items ribbon panel: hide or show the key moments and/or the activities.
- View ribbon panel:
- Set the level of detail of the Gantt chart to days, weeks, months or years
- Show or hide the links between key moments and/or activities
- Hide or show the Details pane at the bottom of the screen
- Hide empty cells: click this button to hide the empty cells at the bottom of each group of items. This will make the view of the planning more compact. You can still insert or add items using the Items ribbon.
Working with the budget
To design the planning of your project, select the Budget tab.
If you want to create an IATI organisation file (by setting the view mode to IATI organisation), you will see an additional Expenses window. This works entirely the same as the Budget window.
The Budget window allows you to identify budget headers that group individual budget items (or sub-headers). A budget can be set up as a single-page budget or as a multi-year budget. In the Budget window, the Details pane has a limited role. You can use it if you want to create a budget item that represents a percentage (ratio) of another item (or total).
Budget items
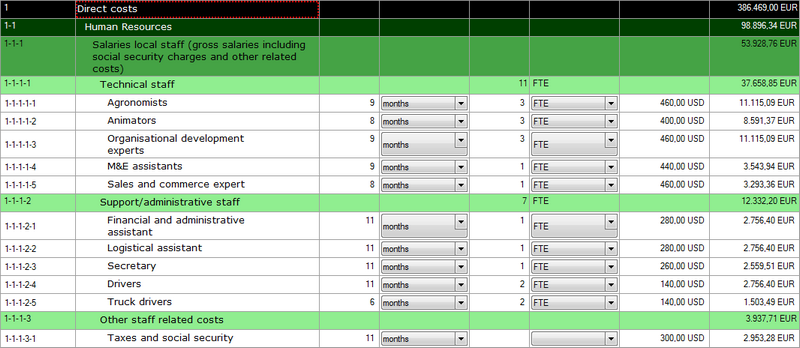
A budget has:
- Budget items: a budget item calculates the cost for a specific item. You can enter:
- The description of the item
- Its duration and duration unit: for instance to calculate wages: 12 months
- Its quantity: for instance ‘5 items ‘or ‘3 persons’. You can select an existing unit from the drop-down list or enter a new one.
- Its unit cost:
- Unit cost expressed in the default currency: simply enter the unit cost of the item
- Unit cost expressed in a local currency: enter the number and select a currency from the Currency drop-down list. If the currency you need is not available, use the Exchange rates window to add new local currencies.
- Budget headers: these group a series of budget items. A budget header can also group other budget headers and you can create as many levels as you like. Logframer automatically calculates the totals of the budget header:
- The total duration: a total will only be made if the duration unit of all the items is the same
- The total quantity: a total will only be made if the number unit of all the items is the same
- The total local currency: a total will only be made if the local currency of all the items is the same
- The total cost
You don't have to fill out all the cells for a budget item. You can:
|
Enter |
Total cost is |
|
Cost/unit only |
Cost/unit |
|
Quantity and a cost per unit |
Quantity x Cost per unit |
|
Duration and a cost per unit |
Duration x Cost per unit |
|
Duration, quantity and cost per unit |
Duration x Quantity x Cost per unit |
A special kind of budget item is the Ratio budget item. With a Ratio item, you can specify that one cost equals to a certain percentage (ratio) of another item or budget header. To create a ratio item:
- Make sure the Details pane is visible (if not, go to the Lay-out toolbar and in the View section click on Show Details).
- On the Type tab of the Details pane, set the Type to ratio using the drop-down list
- In the table that appears, select the reference row that will be the source for your item
- Specify the ratio as a percentage of the amount you're referring to
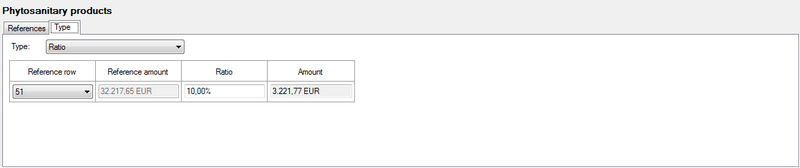
A ratio item is practical if you have for instance administration costs that are a fixed percentage of the total working costs, or if you want to calculate an amount for contingencies as a percentage of other costs.
Moving items around
To select a single budget item, click on it with the left mouse button. To select more than one item, press the left mouse button and drag. The red selection rectangle will expand to include other cells, but you can only select cells within a single section.
To move items, press the right mouse button within your selection (red selection rectangle) and drag it to the place where you want to insert the items. A green indicator line will appear and show the current location. When you come close to the top or bottom border of the logframe, it will scroll up or down. Release the right mouse button to insert the items you selected.
Another way to move items is to use the Move Up and Move Down buttons in the Lay-out ribbon tab.
Copying and pasting budget items
You can cut, copy and paste items in three different ways. First select the items you want to copy paste (see ‘Moving items around’).
- Use the Cut, Copy and Paste buttons of the Items ribbon tab.
- Press Ctrl+X to cut; Ctrl+C to copy and Ctrl+V to paste
- Right click into the red selection rectangle and move the green indicator line to where you want to copy the item(s) (see ‘Moving items around’). But this time hold the Ctrl button when you release the right mouse button. This will copy the selected item(s) instead of cutting and pasting them.
Changing the lay-out of the budget
Using the Lay-out toolbar, you can hide certain columns; view the Exchange rates pane; show or hide the Details pane; switch between simple/multi-year budgets and use one of the pre-defined budget templates.
The Lay-out toolbar has the following ribbon panels and buttons:
- Columns ribbon panel: hide or show the Duration/Duration unit columns and the Local currency columns.
- View ribbon panel:
- Show or hide the Exchange rates pane
- Hide or show the Details pane at the bottom of the screen
- Hide empty cells: click this button to hide the empty cells at the bottom of the budget items of each budget header. This will make the view of the budget more compact. You can still insert or add items using the Items ribbon.
- Structure ribbon panel:
- Switch between simple budget and multi-year budgets
- Use one of the budget templates
Translating content
You can change the language of the user interface, but what if you use the same project documentation in different countries with different languages?
You can translate the content of the logframe, the planning, the budget and text fields such as the title of your project. If text can be translated, you will see that the Translate button in the Text toolbar or the Items toolbar is enabled.
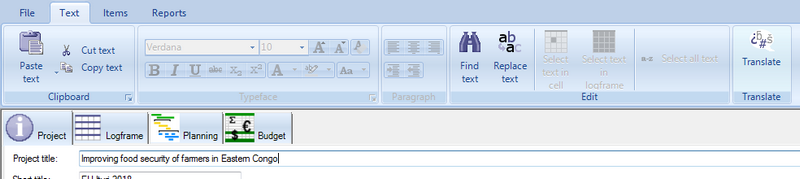
When you press the Translate button, you will see the following pop-up dialogue:
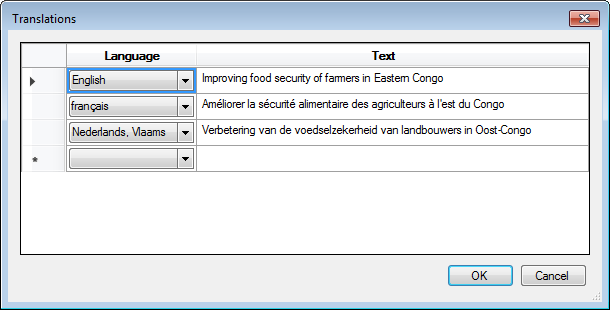
Here you can add as many translations as you want. Select the language in the first column and then the translated text in the second column.
When you return to your main window you will see the English text (if you use the English interface). If your colleague in Mali uses the French interface, he or she will see the French text.
Working with maps
In logframer you can indicate the location of:
- Target groups: pinpoint the location of your target group(s) or draw a line around the area in which they live
- Partner organisations: pinpoint the location of the office(s) of your partner organisations. You can also indicate the location of your own organisation
- Intervention zones: pinpoint the location of your intervention zone(s) or draw a line around the zone(s)
For each of these items you can use a dynamic map of the world that allows you to zoom in and use different drawing tools to indicate a location or area:
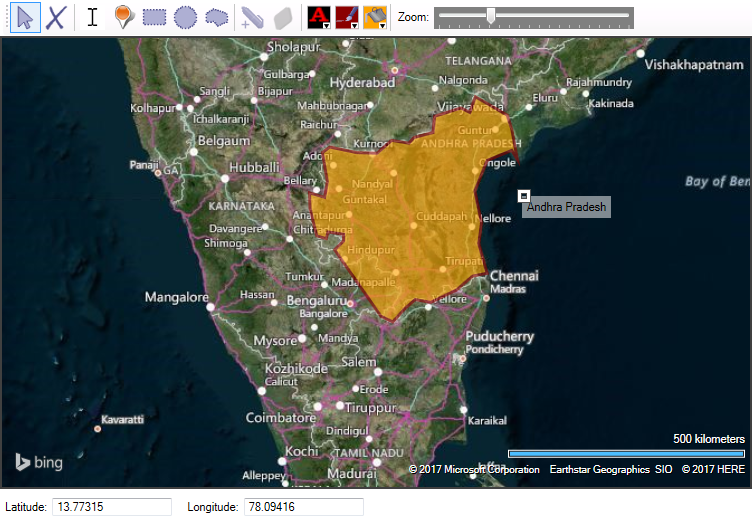
In this section we will explain how to:
- Navigate
- Indicate locations and draw shapes around areas; add labels with text; change the colour of the shapes and text
- Remove pins, text and shapes
- Edit the outline of shapes
How to navigate
To move about in the map
Click somewhere in the map with your left mouse button and drag in the opposite direction of where you want to go. So if you want to move to the east, drag your mouse to the left (west).
To zoom in and out
You can use the zoom slider in the toolbar:
If you have a scroll wheel on your mouse, you can use that to zoom in and out.
When you create a map, Logframer will remember what part of the map you zoomed into, so the next time you open the project you will see exactly the same map on the same scale.
Drawing on maps
You can find the different drawing tools on the toolbar above the map.
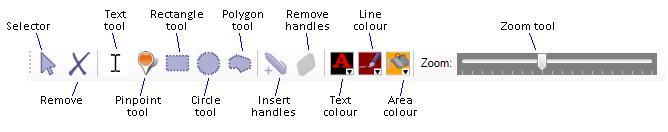
You can indicate
- Individual locations using the Pinpoint tool
- Areas using the Rectangle, Circle or Polygon tool
- Text labels using the Text tool
To add a pin, shape or text, select one of the drawing tools and double-click on the location where you want to start.
For individual locations, the Pinpoint tool is the easiest to use. Double-click on the location and a pin will appear. This pin remains the same size, regardless of whether you zoom in or out.
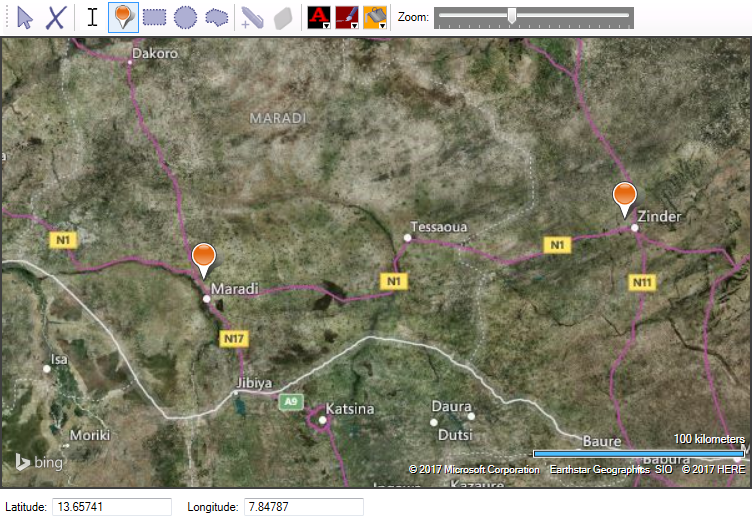
If you want to draw a rectangle or circle around the area of your choice, double-click on the map and then drag to the required size.
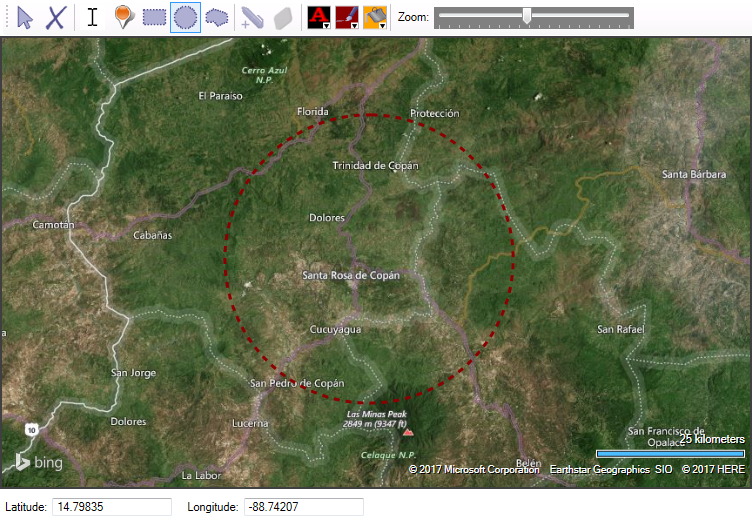
If you want to draw a complex shape (for instance following country or administrative borders) you can use the Polygon tool. Double-click on each corner and gradually return to your starting point.
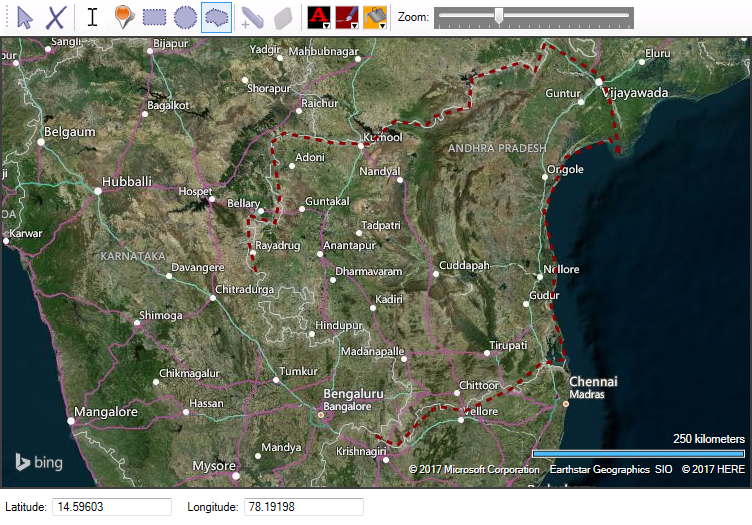
If you want to change the colour of the shape, you must first select it with the Selector tool (the blue arrow in the toolbar). Click with the Selector tool on your shape and you will see handles appear on the corners to indicate it is selected. Then choose the line colour or fill colour of your choice.
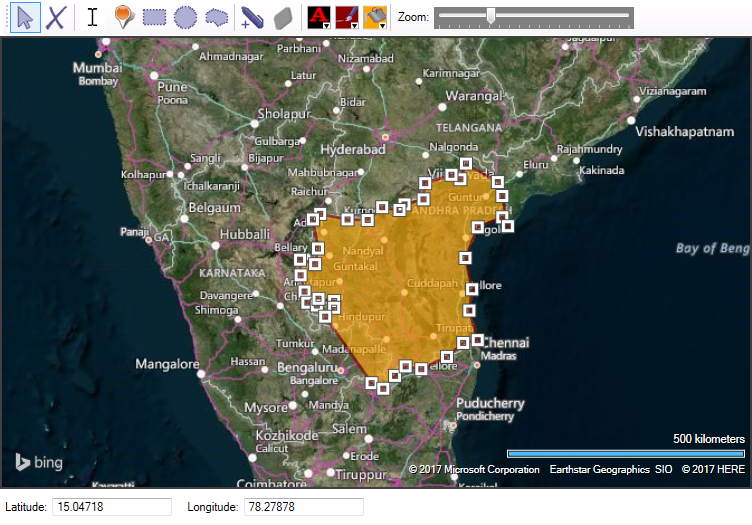
Remove items from maps
To remove a pin, a shape or a label from the map, use the Selector tool (blue arrow in the toolbar) and click on the item you want to remove.

When the item is selected you will see handles appear on the corners (white squares). Then you can press the Remove button (second button in the toolbar) to delete the item.
Editing shapes
Once a shape is drawn on the map you can still modify it. First, use the Selector tool to select the shape (click in the shape).
- If you want to move the location of a corner point, click on the white handle and drag the handle to its new location
- If you want to add a new corner point between two others, choose the Insert handles tool (pen) and double click somewhere between the two neighbouring corners. This tool is only enabled when you have selected a shape.
- If you want to remove a corner point, choose the Remove handles tool and click on the handle (white square) that you want to remove.
Designing the Intervention Logic (Project Logic)
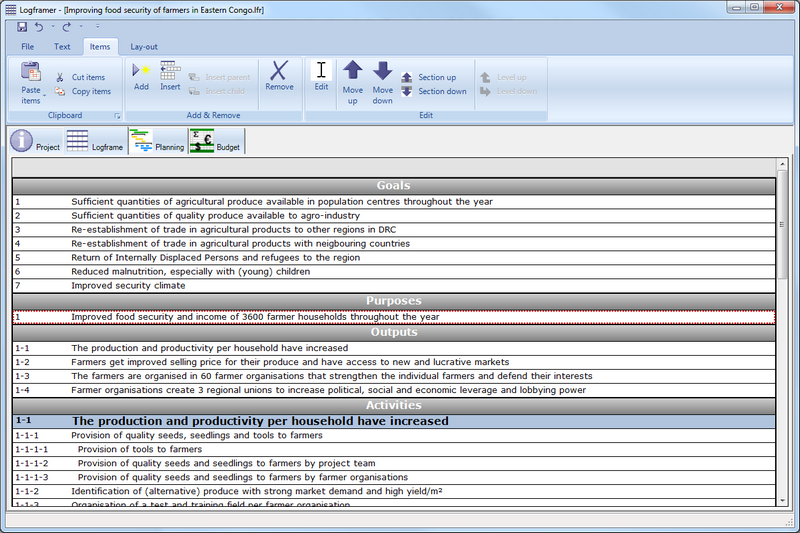
The Project Logic column is the first column of the logical framework. It contains:
- The Goals or long-term, society-wide objectives or challenges that your project will contribute to (top section).
- The Purpose of the project, which is the main objective or reason why the project exists in the first place. The purpose is a medium-term objective that we expect to be achieved by the end of the project (or sometimes even later). It is generally advised to identify a single purpose for each project, but in Logframer you can work with multiple purposes if you want.
- The Outputs are the tangible results of the activities. These are the items, knowledge, services, etc. that you get at the end of an activity, or at the end of a series of activities (process). Together, the outputs will enable you to achieve the main purpose of the project
- The Activities are what you have to do to achieve the necessary outputs that in turn will realise the main purpose of the project (bottom section). You can have singular activities, but also complex processes that consist of several activities or even sub-processes.
This description of the intervention logic is very much founded on the Logical Framework Approach (or PCM, or RBM). However, Logframer’s focus lies with project design in general and not with any particular approach. So you are completely free to use some sections and leave others empty (which you can hide, see Changing the lay-out of the logframe).
For instance, if you use the Outcome Mapping approach you can focus entirely on long-term and medium-term objectives (Goals and Purposes) and leave the Outputs and Activities sections empty. You can rename the Purposes section to Outcome challenge and the indicators column to Progress markers.
At first, it's wise to just note down some keywords or key ideas before you start to worry about the exact formulation. At this point you can still move things about with Logframer’s drag-and-drop abilities. You can use the text tools to improve the text or use the marker tool to indicate ideas that have to be elaborated further etc.
Using key-ideas at first allows you to focus on the essence and to make sure that everyone involved in the project understands these terms the same way you do. Watch out for complex concepts such as ‘gender’, ‘democratic’, ‘durability’... that may be understood differently in various cultural settings.
Participatory design
For training purposes, this manual will focus on how you can design a project as an individual. However, it is important to ensure that your project is relevant for the target groups; effective (able to achieve the objectives); efficient; has a positive impact and reduces any negative impact and has sustainable results and is both financially and ecologically durable (see OECD DAC criteria for evaluating development assistance: http://www.oecd.org/dac/evaluation/daccriteriaforevaluatingdevelopmentassistance.htm )
The best way to ensure this, is to work in a participatory way both during the design phase of the project as during its execution and follow-up. You can find more information participatory approaches such as LFA, PCM and RBM on the this website.
Designing bottom-up or top-down
‘Bottom-up’ or ‘top-down’ doesn't refer to the question whether the boss has designed the project or the employees or beneficiaries/clients (see Participatory design).
Instead it's about the choice of designing the intervention logic by starting with the activities or with the main purpose of your project:
- Some people prefer to list the activities first, then identify the outputs that they will create and then formulate a purpose that describes what these amount up to.
- Other people prefer to identify the main purpose first, then list the outputs that are necessary to realise this purpose and then the activities necessary to produce the outputs.
Whatever way you prefer, you can do it in Logframer. When you list the activities first, Logframer will create a place-holder output and purpose
Relationships between Goals, Purposes, Outputs and Activities/Processes
You can identify as many Goals as you want. Goals are not linked to other project logic items, meaning that when you move them about, other project logic items (purposes, outputs…) will not move.
You can identify one or more Purposes. It is often advised to identify only a single purpose, but it is not forbidden and Logframer will allow you to identify more than one.
Each purpose can have several Outputs. If you have more than one purpose, the outputs will be grouped below a title with the purpose.
Each output can have several Activities. If you have more than one output, the activities will be grouped below a title with the output. If you have more than one purpose, the activities will also be grouped below a title with the purpose.
Each activity can have several sub-activities. We call an activity with sub-activities a Process. Each process can have sub-processes with sub-processes, with sub-processes, with…
Managing Risks, Assumptions and Dependencies
The Risks and Assumptions column is the fourth column of the logical framework. The assumptions describe the situations, events, conditions or decisions which are necessary for the success of the project, but which are largely or completely beyond the control of the project's management. Risks are events that may have a negative impact on the project.
The fourth column and the first column have an if… then… relation. If the assumptions in column four are met, or if the risks do not occur, then we'll achieve what we've set out to do in column one.
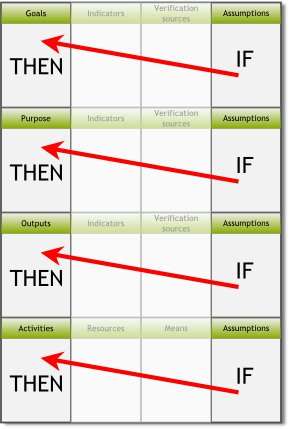
RAID
Logframer allows you to use the RAID typology. RAID stands for:
- Risks: events that may have a negative impact on the project
- Assumptions: these are the situations, events, conditions or decisions which are necessary for the success of the project, but which are largely or completely beyond the control of the project's management.
- Issues: these are problems that you have to deal with today in order to ensure your project runs smoothly. Issues occur during the execution of the project. They are not things that may occur like risks, but actual problems that you encounter
- Dependencies: this means that your project needs the output from another project (or partner); or that another project depends on an output of your project.
Risks, assumptions, issues and dependencies exist in different parts of the project's time-line:
- Risks: you identify risks during the design phase. Risks may or may not occur during the execution phase and it’s therefore important to follow them up using the Risk Register.
- Assumptions: you identify assumptions during the design phase and you think of ways to deal with them so your project can start up. If there are any critical assumptions, it’s possible that you won’t be able to start the project unless you redesign it completely, or postpone it until the circumstances have changed.
- Issues occur during the execution phase of the project
- Dependencies can have an influence during the design phase (because your project can’t start without certain external outputs) or during the execution phase. They can also influence the course of future projects because they depend on the results of your project.
Use the Details pane to specify whether an item of the fourth column is a risk, an assumption or a dependency. Because issues only occur during the execution phase, you can’t identify an item as an issue in Logframer.
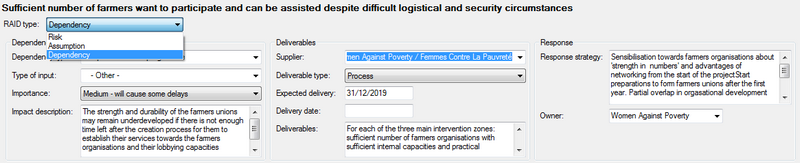
Dealing with Risks
To identify an item as a risk, use the RAID type selector (first field) and select ‘Risk’ from the drop-down list.
Here you can:
- Assess how likely the risk is and what impact it would have on your project. Logframer will then calculate a Risk percentage.
- Specify how you want to deal with the risk once it occurs: will you try to avoid, reduce, share, transfer or accept the consequences of the risk? How will you deal with it and who will be responsible for dealing with the risk and its consequences (the owner)?
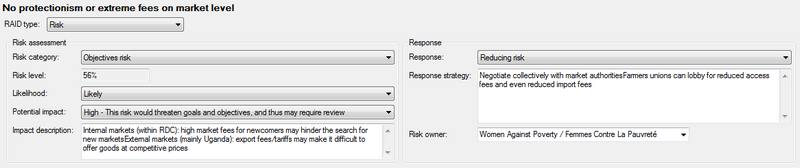
Tools: the Risk Register
The Risk Register is a report that you can either print or export to MS Word or MS Excel. The print version and the MS Word version give you an overview of the risks and what you will do in response; the objectives they may influence and the risk level at the onset of the programme.
You can select if you want to view all risks or the risks of a specific category (operational; financial; objectives; reputation risks)?
If you export the Risk Register to MS Excel, you will get an interactive tool to assess the likelihood and possible impact of each risk over the course of your project. This will allow you to see how each risk evolves over time and what measures you must take to deal with them.
Assumptions
To identify an item as an assumption, use the RAID type selector (first field) and select ‘Assumption’ from the drop-down list.
Here you can:
- Explain the reason for the assumption
- How you will validate whether it influences your project and whether the assumption has been validated
- Once validated how may the assumption have an impact on your project?
- How you've dealt with this assumption in the design of your project
- Who is responsible for dealing with this assumption (the owner)
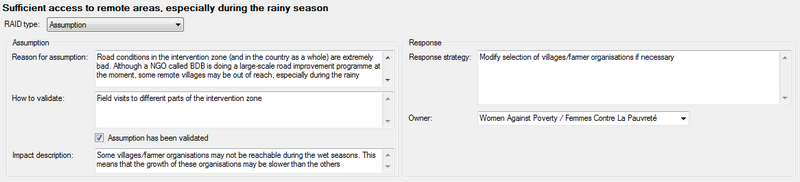
Tools: the Assumptions Table
The Assumptions Table is a report that you can either print or export to MS Word. It provides an overview of the assumptions of each objective.
In print preview, you can select if you want to view all assumptions, or only the assumptions of a certain level (goals, purposes, outputs, activities).
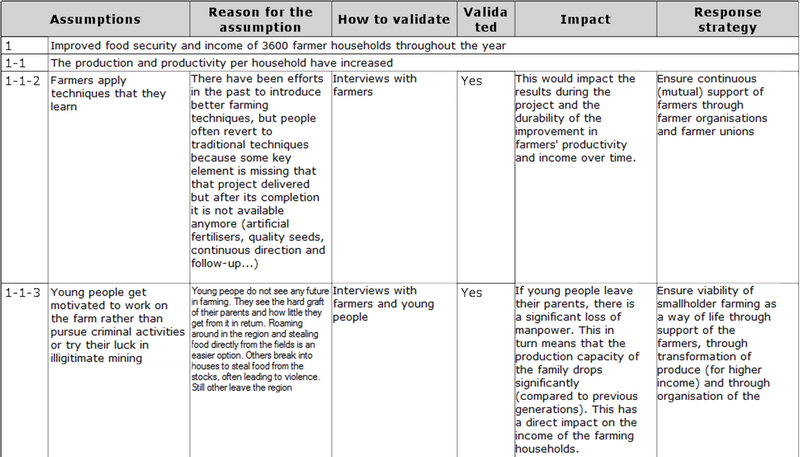
Dependencies
To identify an item as a dependency, use the RAID type selector (first field) and select ‘Dependency’ from the drop-down list.
Here you can:
- Specify the type and possible impact of the dependency
- What deliverables you expect and when
- How you will deal with the situation if the necessary inputs don't show up
- Who is responsible for dealing with this dependency (the owner)
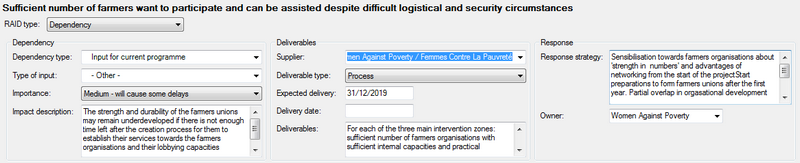
Tools: the Dependencies table
The Dependencies Table is a report that you can print. It provides an overview of the dependencies of each objective.
In print preview, you can select if you want to view all dependencies, or only the dependencies of a certain level (goals, purposes, outputs, activities).
Designing the monitoring and evaluation system
To design the project's monitoring and evaluation system (M&E system) you use the second and third columns of the logical framework, with the Indicators and Verification Sources respectively.
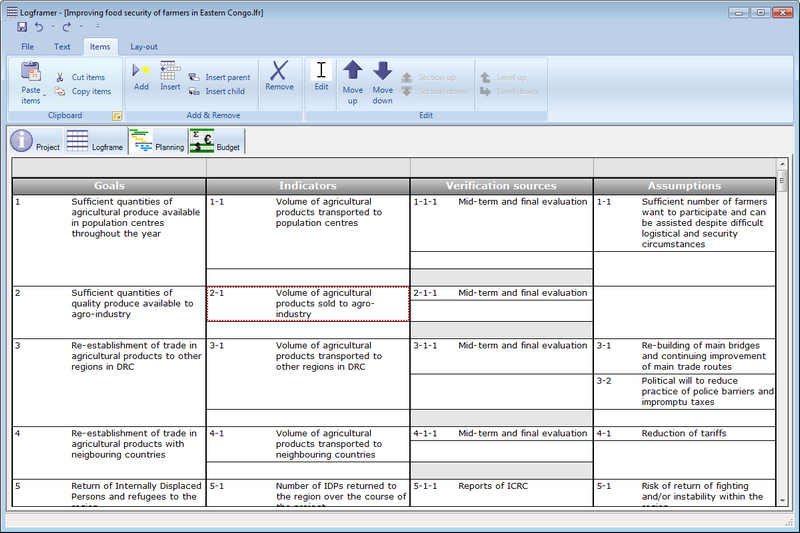
Once you've listed the indicators that you will need to follow-up each goal, purpose or output (and activity if you want to), you can use the Details pane to choose the type of indicator and other options such as the value unit, the value range, etc. You can also register the baseline and set targets.
With all this information you can create the Monitoring tool in MS Excel. This tool allows you to follow-up the progress of your project over time:
More often than not, organisations use value-based indicators to monitor the progress of their project and assess its effects and broader impact. This is certainly a valid way to work, but that doesn't mean that ‘indicator’ must be synonymous with ‘values’. Logframer offers you many different types of indicators:
- Without targets
- Values
- Multiple options
- Ordinal questions
- Expressing opinion
This means that Logframer gives you the flexibility to do ‘strict’ logical framework methods with ‘hard’ values. But you can also use different approaches such as Outcome mapping, using open ended questions for your proxy indicators.
Logframer offers you many options to specify units, value ranges, scores, etc., but that doesn't mean you are obliged to use all these options. Select the tools that best fit your way of working – don't let the tools prescribe how you should do things.
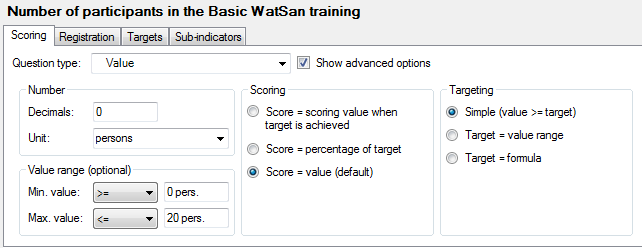
Indicators and sub-indicators
To add indicators to a goal, purpose, output or activity, you just start typing in the empty cell to its right in the Indicators column.
Indicators can have sub-indicators. This enables you to split more complex indicators into their basic components. You can add as many levels of sub-indicators as you want.
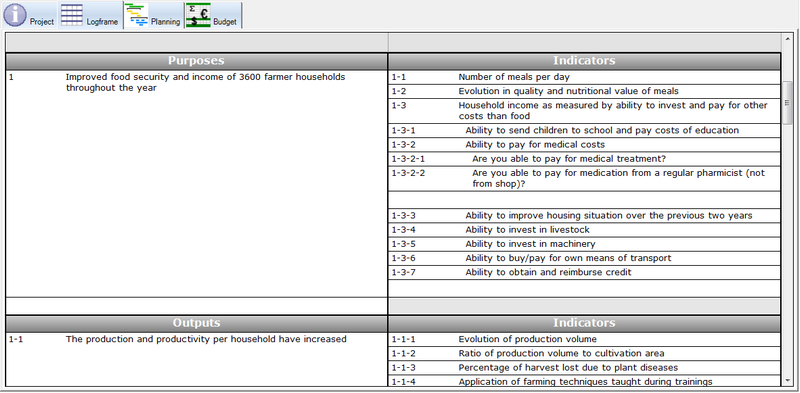
Adding sub-indicators and parent indicators:
- To turn an indicator into a sub-indicator of the indicator that's above it, click on the Level down button in the Items toolbar.
- If you want to insert a new sub-indicator below a main indicator, select the main indicator and then press the Insert child button.
- If you want to turn an existing indicator into a child indicator of a new parent, select the indicator and then press the Insert parent button.
The total value or total score of the indicator is calculated automatically based on the values of its sub-indicators:
- Value indicators that have sub-indicators with the same unit (for instance ‘items’) have a total value expressed in that unit (15 tonnes + 7 tonnes + 12 tonnes = 34 tonnes)
- Indicators such as multiple choice indicators, yes-no indicators and so on use scores. For each option you can specify a score value and on the level of the parent indicator these scores are added.
- For values indicators you can also specify scores (for instance >15 tonnes = score value of 5) and in that case the total scores are calculated.
- When you have a combination of values and other types of indicators, you must use scores for the values so that total scores can be calculated.
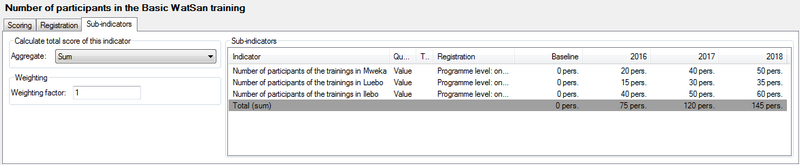
Baseline and targets
For each type of indicator you can register a baseline value. The baseline is the measurement you make before your project (or at least any of the project's activities) starts.
Some types of indicators use targets, while others have none. If you use targets, you can specify different targets according to the calendar of the Monitoring Deadlines.
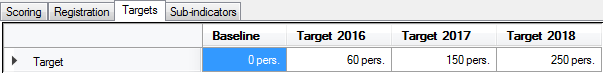
Registration (project level, team level, beneficiary level)
Some information can be found or registered centrally, for instance impact indicators that take information from government statistics. These can be entered by someone at your office.
In other cases you may have different teams in the field that register information about their beneficiaries or intervention zone. To get the total results at project level you may have to make a total of the numbers of the various teams.
It's also possible that you need to register information for every beneficiary (or a sample of the group of beneficiaries). The total number/score for that indicator at project level is then calculated as the total sum of the beneficiaries.
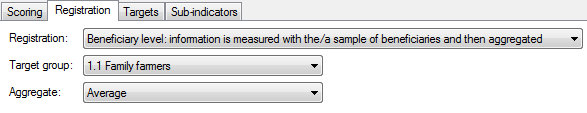
In the Indicator Details pane, select the Registration tab. Use the Registration drop-down box to select one of these three options:
- Programme level: one (periodic) measurement for the whole programme
- Team level: measurements of different teams can be aggregated on programme level
- Beneficiary level: information is measured with the/a sample of beneficiaries and then aggregated
Select the target group for which the indicator will be used. You can also use an indicator for all target groups
Use the Aggregate drop-down list to choose how you want to aggregate the information from the different teams or beneficiaries:
- Sum
- Average
- Minimum value
- Maximum value
- Spread
- Distribution
Targeting systems
For value-based indicators, you can choose how you will define your targets:
- As a simple target value
- As a value range, for instance:
- Minimum number of patients of a local health-care centre: x > 250 / month
- Maximum delinquency percentage of loans (non re-imbursement): x <= 7%
- Number of children per teacher: 20 <= x <= 35
- As a formula, for instance
- Target year 1 = 2 x baseline value
- Target year 2 = 3 x baseline value
- Target year 3 = 4 x baseline value
In the Indicator Details pane, select the Scoring tab and go to the Targeting box (on the right). Select one of the three options.
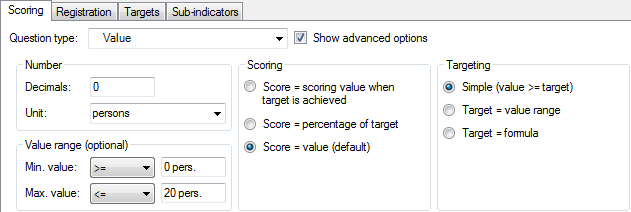
To set the actual targets, go to the Targets tab.
If you use a simple target value, you can enter it directly in the cells
If you use a value range, a pop-up window will appear (double-click on the cell if it doesn't) where you can set a minimum value and/or a maximum value. To do so, select the sign (<; >; <=; >=) and enter a value. If you don't select a sign, the min/max value won't be used:
- For x < 10: do not select a sign or enter a value for Minimum value, only for Maximum value
- For x > 10: do not select a sign or enter a value for Maximum value, only for Minimum value
- For 5 < x < 10: select a sign and enter a value for both Minimum and Maximum value
Scoring
For questions with targets, you can choose which (total) value the indicator will produce:
- With value-based indicators, you can opt to simply use the value you enter. For instance: 10 pieces or 30 items or 100 tonnes…
- You can also choose to give a score to a certain result:
- With value based indicators: you can indicate that a total production of more than 50 tonnes get a score of 1, a production of more than 100 tonnes gets a score of 2 and production of more than 500 tonnes get a score of 3
- With multiple options questions, ordinal questions, opinion scales etc. you can accord a score to the different options. For instance: yes = 1 and no = 0
- Finally, you can express the result as a percentage of the total.
- For value-based indicators, if the target was 400 participants to a training and you actually had 374 participants, the percentage of the indicator is 93.5%
- For multiple options questions, ordinal questions, opinion scales etc. a score of 2 on a maximum of 5 gives a percentage of 40%
To set the actual scores:
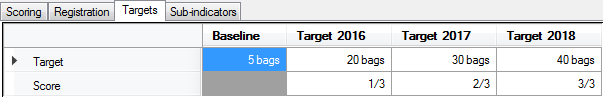
- For value-based indicators, select the Targets tab:
- If you use a simple target value, you can enter it directly in the cells
- If you use a score, set the score directly in the cells below the target values
- If you use a percentage, the target value will always be 100%. If you use the Monitoring tool in Excel, the measured value will be transformed into a percentage of the target value
- For multiple options questions, ordinal questions, opinion scales etc., select the Scoring tab:
- If you use a score, you can specify the scoring value of each option or statement in the list
- If you use a percentage and you use the Monitoring tool in Excel, the value of the option/statement you select will be transformed into a percentage of the maximum score that can be achieved.
Question types
Value-based indicators are probably the most popular type of indicators used for monitoring projects. However, they may not always be the best choice. Logframer offers you no less than 17 different types of indicators to make sure you have the right indicator for the right occasion. They are grouped in five main groups:
- Indicators without targets: sometimes it is impossible to predict what changes will be brought about by your project, but you still want to know what the effects are.
- Value-based indicators: the most used and arguably the easiest way to keep track of your project
- Multiple option indicators: if you have indicators with multiple dimensions, multiple option or multiple choice indicators can be the right choice.
- Ordinal indicators: similar to multiple choice or multiple option, but in this case there is a particular order in the possible answers, from low to high or from small to big or…
- Indicators to express opinion: to measure more complex things like opinions and behaviour you may need answer scales such as the Likert scale that make use of different statements. The development of such indicators takes more effort but in certain circumstances they can be very valuable.
Before you start detailing your indicators, the first choice you have to make is on the right type of question to use. On the Scoring tab, select one of the options from the Question type drop-down list:
|
Indicators without targets |
Ask a question and specify how much space the respondent (or interviewer) gets to answer |
|
|
|
The respondent gets a number of different options and can indicate which is the best and the worst option |
|
|
|
Include a picture of the situation before the project. For each report the respondent has to include a follow-up picture |
|
|
Value-based indicators |
Specify baseline and target values; choose the unit (items, kg, liters…) and specify a value range if necessary (min. and maximum values) |
|
|
|
Same as the above, but expressed as a percentage |
|
|
|
The respondent has to provide two numbers and then the ratio is calculated (for instance ratio of girls to boys in schools) |
|
|
|
Allows the respondent to give a series of numbers. You can specify a formula to give you the total number you want. Useful for sums of a series of items, complex ratios etc. |
|
|
Multiple options |
Respondent/interviewer can tick the box next to yes or no |
|
|
|
Identify different options so the respondent/interviewer can tick one or more of the options |
|
|
|
Identify different options so the respondent/interviewer can tick (only) one of the options |
|
|
Ordinal questions |
Identify different options, which the respondent has to rank according to his/her preference |
|
|
|
A typical Likert scale has five options (but can also be less or more), for example: strongly disagree; agree; neutral; disagree; strongly disagree. This indicator has only one statement to score |
|
|
|
Similar to a Likert type scale, but with a series of pairs: interesting – not interesting; practical – not practical; smurf – not smurf |
|
|
Expressing opinion |
Uses a series of statements on which the respondent can indicate if he/she agrees or disagrees with the statement. Each statement expresses a more or less positive attitude towards the concept that’s being analysed. These statements have been issued a score before based on a preliminar survey. This score is then used to measure the attitude of the respondent. |
|
|
|
Similar to Thurstone scale in design, but instead of a choice between agree/disagree, the respondent can give a more nuanced answer by indicating how strongly he/she agrees or disagrees. |
|
|
|
Similar to Thurstone scale, but the statements are ranked, meaning that if you agree with the fourth statement, it is understood that automatically you agree with the three that came before. |
|
|
|
A likert scale that is useful for working with groups, organisations, etc. because instead of indicating what the answer is of one person, you can register how many people have chosen that particular option (frequency). |
|
|
Other types |
Not only can you show an image of the baseline situation, but you can also include images of how the situation will look like from one moment to the other. |
|
|
|
Mixed sub-indicators |
If you add sub-indicators of different question types to a main indicator, the question type of the latter will be set to ‘Mixed sub-indicators’. The total score of this main indicator is always a score (never a value or percentage). |
Open ended question
Set the amount of white space that you want to give to the respondent/interviewer on the questionnaire.
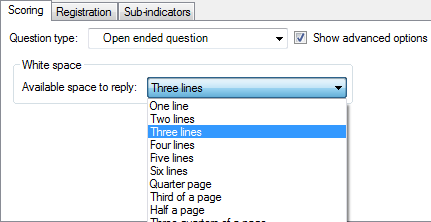
Best/worst scaling (Max Diff)
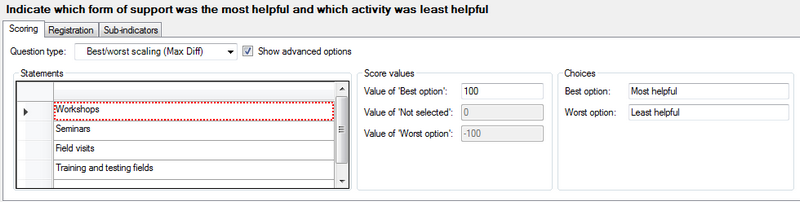
On the Scoring tab:
- Enter the options that the respondent can choose from in the Statements list
- Give a scoring value for the ‘Best option’, for instance 100. The ‘Not selected’ option will always be 0 and the 'Worst option' is the inverse of the Best option (-100).
- You can change the text for Best and Worst option in the Choices box.
Images
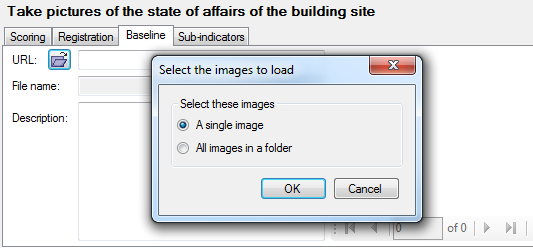
On the Baseline tab:
- Click on Open document icon next to URL to select the picture that you want to open
- You can add a description of the picture
Values
On the Scoring tab:
- Number box: indicate the precision (number of decimals) and select a unit from the list, or enter a new unit. If you enter a custom unit it will become available for all indicators in the current project (but not in other projects).
- Value range box: You can limit the value range that the respondents can give by specifying a minimum value and/or a maximum value. This means that you can’t enter target values that lie outside this value range.
- Scoring and Targeting: see the page on this topic
On the Targets tab:
- Specify the target values in the cells of the first row
- When you measure at beneficiary level, specify which percentage of the target group you expect to reach that target. On the bottom row Logframer will calculate the total values for the target population.
With scoring:
Beneficiary level monitoring:
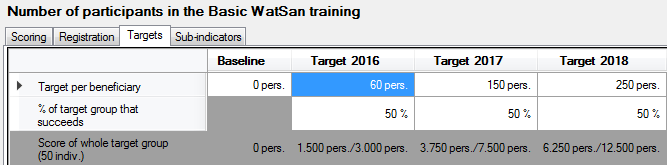
Beneficiary level monitoring with scoring:
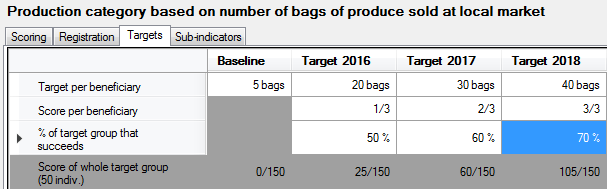
Percentages
On the Scoring tab:
- Number box: indicate the precision (number of decimals). The unit is ‘%’ by default.
- Value range box: You can limit the value range that the respondents can give by specifying a minimum value and/or a maximum value. This means that you can't enter target values that lie outside this value range.
- Scoring and Targeting: see the page on this topic
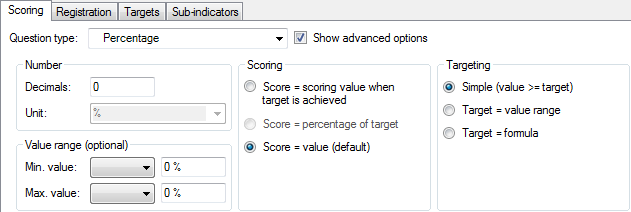
On the Targets tab:
- Specify the target percentages in the cells of the first row
- When you measure at beneficiary level, specify which percentage of the target group you expect to reach that target. On the bottom row Logframer will calculate the total values for the target population.
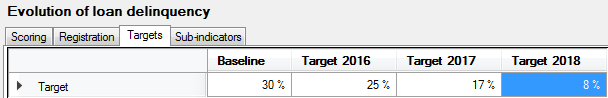
Beneficiary level monitoring:
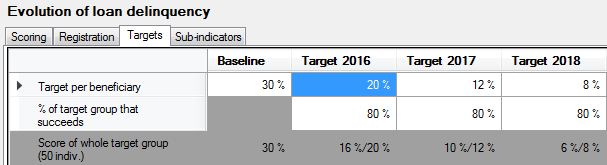
Ratio
To calculate a ratio, the respondent has to answer to two questions. For each question, you can specify the number of decimals, unit and value range.
On the Scoring tab:
- For the first and second question:
- Enter the question in the first question / second question box
- Number box: indicate the precision (number of decimals) and select a unit from the list, or enter a new unit. If you enter a custom unit it will become available for all indicators in the current project (but not in other projects).
- Value range box: You can limit the value range that the respondents can give by specifying a minimum value and/or a maximum value. This means that you can’t enter target values that lie outside this value range.
- Scoring and Targeting: these options concern the total value/score of the indicator, not the individual questions. For more information, see the page on this topic
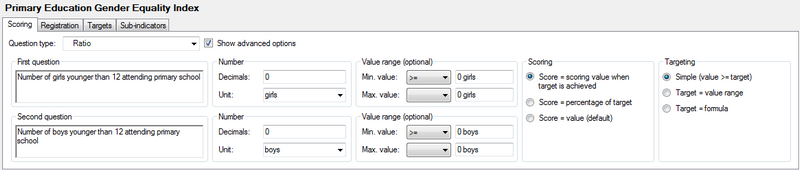
On the Targets tab:
- Specify the target values for the first question in the cells of the first row
- Specify the target values for the second question in the cells of the second row
- Logframer will calculate the ratio in the third row
- When you measure at beneficiary level, specify which percentage of the target group you expect to reach that target. Because the ratio is a kind of average, you won't see another row with total values as you have in other types of indicators.
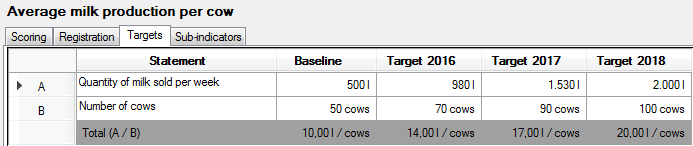
With scoring:
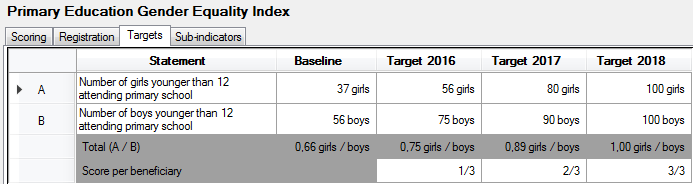
Beneficiary level monitoring:
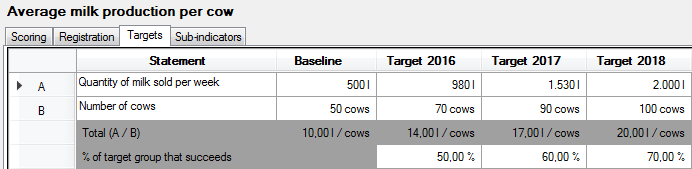
Beneficiary level monitoring with scoring:
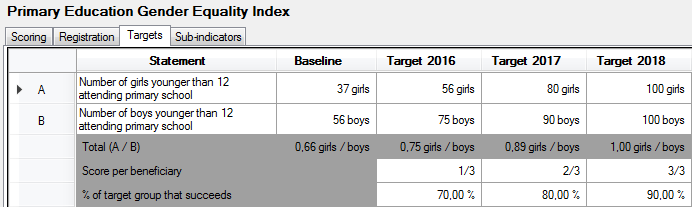
Formula
On the Scoring tab:
- Enter a series of questions or statements in the Questions box.
- For each question you can specify the number of decimals, the unit and a value range (with a minimum value and a maximum value)
- Formula: here you can enter the formula to calculate the total. By default, Logframer will construct an addition of the rows (A+B+C+D…), but you can create your own formulas more or less like you would in Excel:
- Allowed operators: A+B; A-B; A*B; A/B
- Numbers are allowed: A*10
- Brackets are also allowed, for instance: (A+B)/(C+D)
- Excel functions such as SUM, AVERAGE, etc. are NOT allowed
- Number box: specify the precision (number of decimals) and the unit for the result of your formula. Logframer will attempt to determine the unit based on the units of the questions and your formula. For instance: if the unit of question A and question B is ‘kg’ and the unit of question C is ‘m²’ and the formula is (A+B)/C then the resulting unit will be kg/m². However, you can also select a unit from the drop-down list or enter a new unit.
- Scoring: see the page on this topic
- Targeting: for the Formula question type, you can only use values for your targets, not scores.
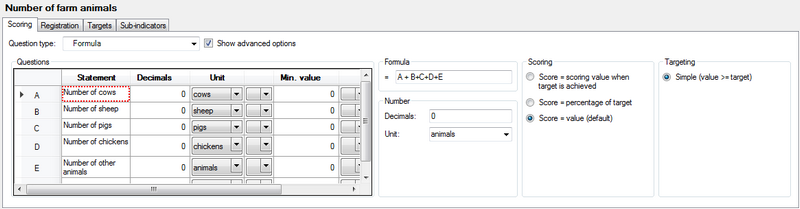
On the Targets tab:
- Specify the target values for the questions in the ‘Baseline’ and ‘Target’ columns
- At the bottom, the resulting total will appear according to your formula
- When you measure at beneficiary level, specify which percentage of the target group you expect to reach that target. On the bottom row Logframer will calculate the total values for the target population.
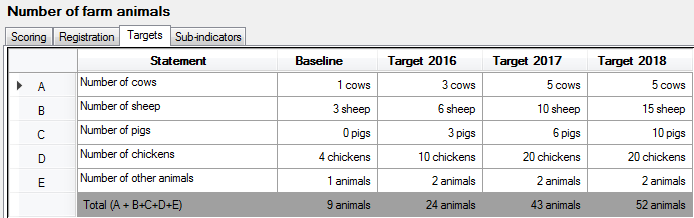
With scoring:
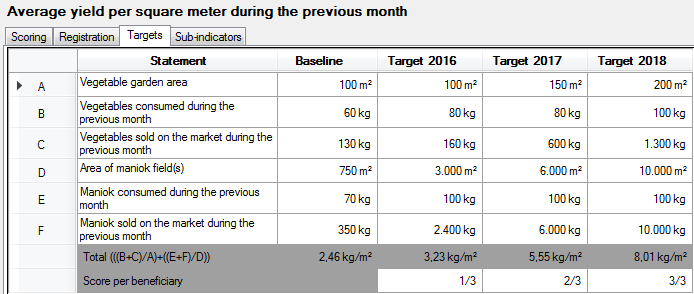
Beneficiary level monitoring:
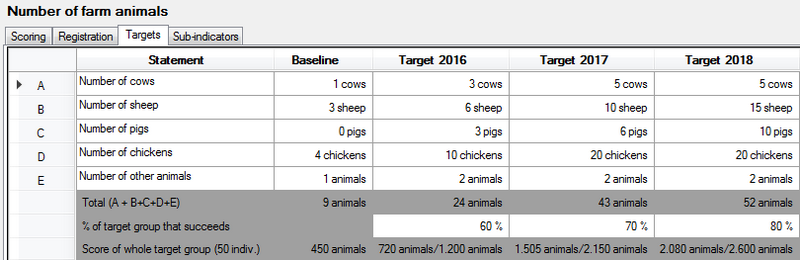
Yes/no question
On the Scoring tab:
- Score values box: enter a value for ‘yes’ and ‘no’ (typically ‘yes’ would be 1 and ‘no’ would be 0). If you want to use values with one or more decimals, use the Number box to set the number of decimals
- Scoring: see the page on this topic
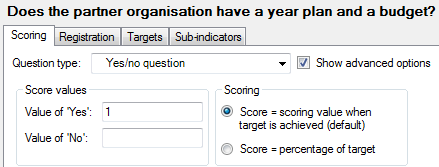
On the Targets tab:
- For the baseline and targets, click in the checkbox next to Yes or No
- When you measure at beneficiary level, specify which percentage of the target group you expect to reach that target. On the bottom row Logframer will calculate the total scores for the target population.
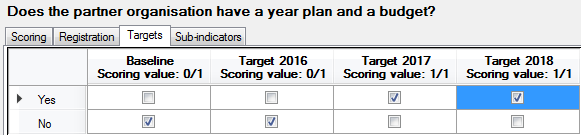
Beneficiary level monitoring:
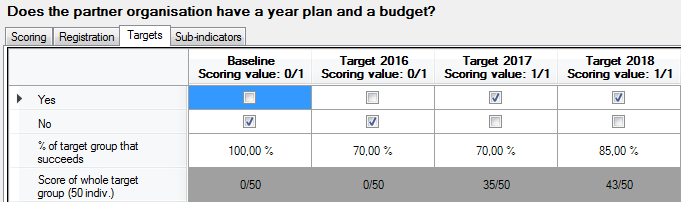
Multiple options
With the Multiple Options question type, the respondent (or interviewer) can select one or more options from a list. If you want to ensure that he/she can only select a single option, use the Multiple Choice question type.
On the Scoring tab:
- Score values box: enter the different options that the respondent will be able to choose from. Then enter a scoring value for each option. If you want to use values with one or more decimals, use the Number box to set the number of decimals
- Scoring: see the page on this topic
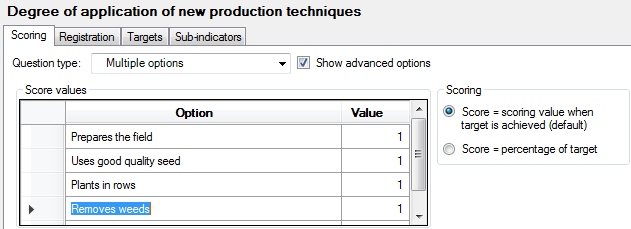
On the Targets tab:
- For the baseline and targets, click in the checkbox next to the relevant options
- When you measure at beneficiary level, specify which percentage of the target group you expect to reach that target. On the bottom row Logframer will calculate the total scores for the target population.
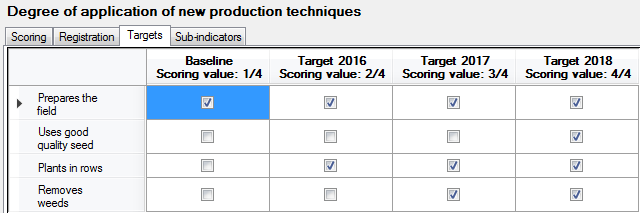
Beneficiary level monitoring:
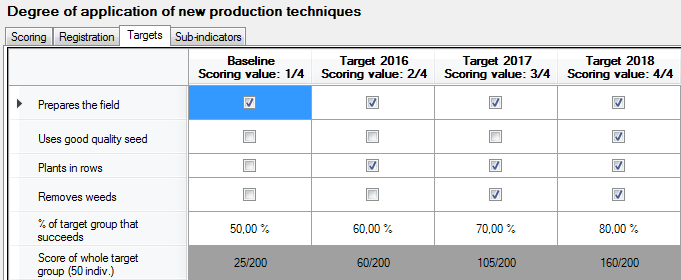
Multiple choice
With the Multiple Choice question type, the respondent (or interviewer) can select only one option from a list. If you want to ensure that he/she can only select a one or more options, use the Multiple Option question type.
On the Scoring tab:
- Score values box: enter the different options that the respondent will be able to choose from. Then enter a scoring value for each option. If you want to use values with one or more decimals, use the Number box to set the number of decimals
- Scoring: see the page on this topic
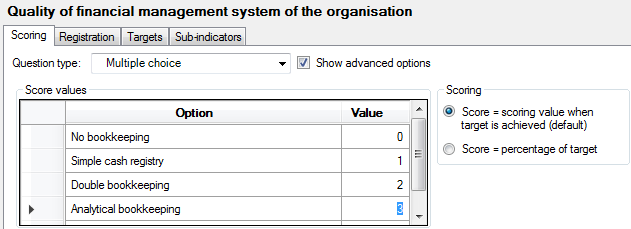
On the Targets tab:
- For the baseline and targets, click in the checkbox next to the relevant options
- When you measure at beneficiary level, specify which percentage of the target group you expect to reach that target. On the bottom row Logframer will calculate the total scores for the target population.
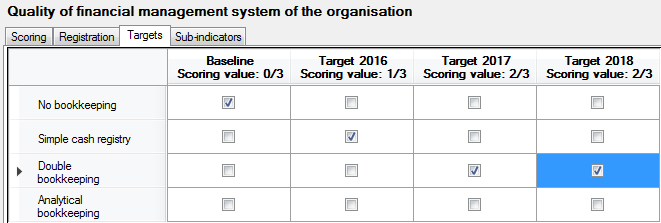
Beneficiary level monitoring:
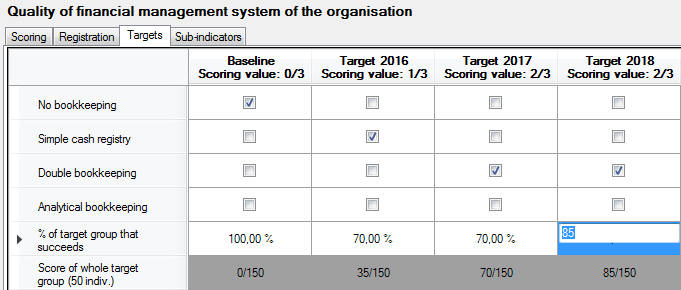
Ranking
On the Scoring tab:
- Score values box: enter the different options that the respondent will be able to choose from.
- Scoring: see the page on this topic
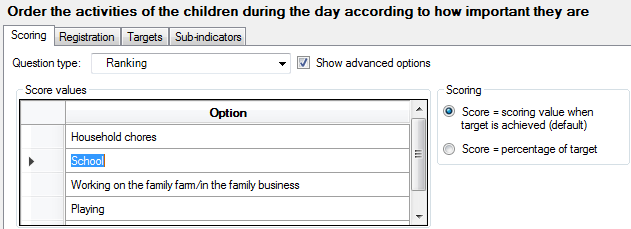
On the Targets tab:
- For the baseline and targets, use the drop-down list of the cells to select the order of preference of the respondent. You can select a value between 0 and the number of options you specified on the Scoring tab. For the targets it can be difficult to precisely predict the order in which the respondent will answer. So you may just focus on the most important item (target item) and show how it will evolve over time.
- When you measure at beneficiary level, you cannot specify the percentage of the target group as you would for other types of questions.
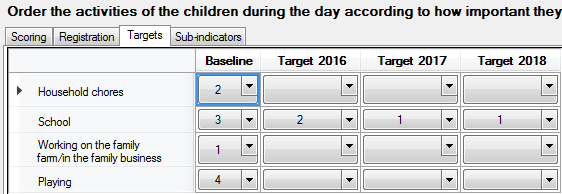
Likert type scale
The difference between the Likert-type scale and a full-blown Likert scale is that the Likert-type scale only uses a five-point (or seven-point, or whatever you prefer) to answer on a single question. A full-blown Likert scale on the other hand uses a series of statements that explore different dimensions of a subject.
On the Scoring tab:
- Score values box: enter the different Likert scale options that the respondent will be able to choose from. A typical Likert scale has five or seven options (five-point Likert scale or seven-point Likert scale), which means that there is a neutral option in the middle. But you can also use an even number of options and use more or less options than five or seven. For example:
- Strongly disagree – disagree – neutral – agree – strongly agree
- Very good – good – bad – very bad
- Enter a scoring value for each option. If you want to use values with one or more decimals, use the Number box to set the number of decimals
- Scoring: see the page on this topic
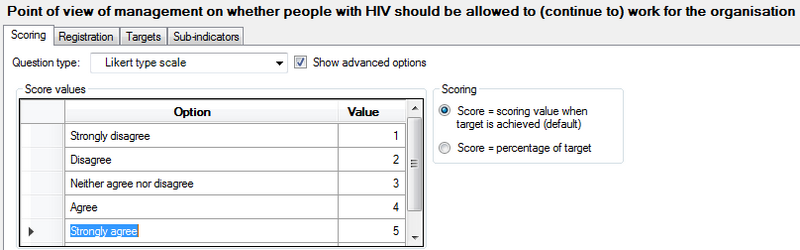
On the Targets tab:
- For the baseline and targets, click in the checkbox under to the relevant option. You can only select one option.
- When you measure at beneficiary level, specify which percentage of the target group you expect to reach that target in the column on the right. In the far right column Logframer will calculate the total scores for the target population.
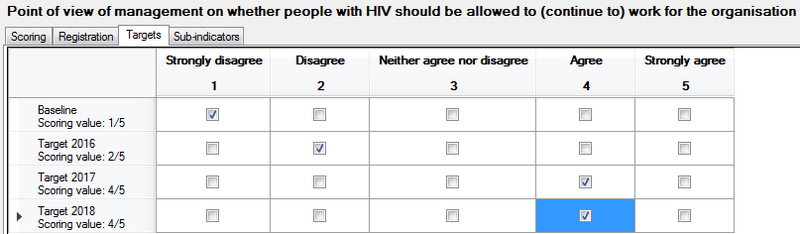
Beneficiary level monitoring:
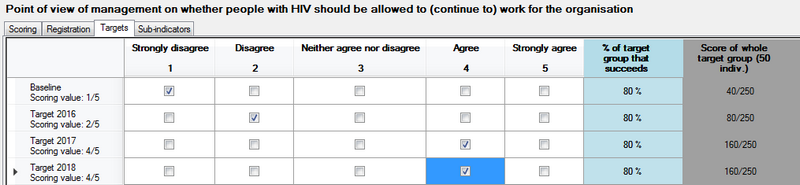
Semantic differential
A semantic uses pairs of adjectives to measure a person's attitude towards something. For instance: ‘The workshops on sustainable organic fertilizers were:’
- Not interesting – Interesting
- Not to the point – to the point
- Not practical – Practical
- Not participatory – Participatory
- Difficult to put into practice – Easy to put into practice
To answer, the respondent can use a series of options that allow him/her to express different degrees of agreement with one of the two extremes. If you use an uneven number of options you can use a ‘Neutral’ option in the middle.
On the Scoring tab:
- Score values box: enter the items (degrees) of the scale that the respondent will be able to choose from. These items specify the adjectives that the respondent can choose from and mirror each other, for example:
- Extremely – quite – slightly – neutral – slightly – quite - extremely
- Very – a bit – neutral – a bit - very
- Enter a scoring value for each option. If you want to use values with one or more decimals, use the Number box to set the number of decimals
- Scoring: see the page on this topic
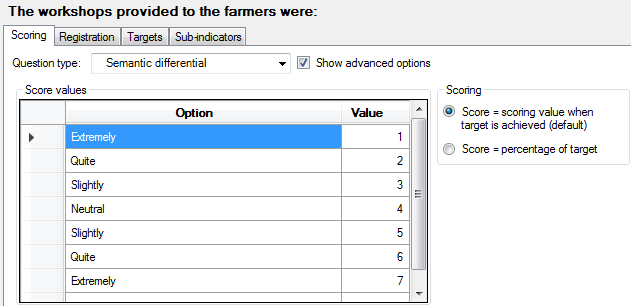
On the Targets tab:
- The Targets tab is divided in another series of tabs: one for the baseline and one for each target
- Add statements by entering the adjective pairs in the first and last column (Statement columns). When you enter or modify statements in the Baseline tab they will automatically be copied to the targets.
- Select one of the checkboxes for each statement.
- When you measure at beneficiary level, specify which percentage of the target group you expect to reach that target. On the bottom row Logframer will calculate the total scores for the target population.
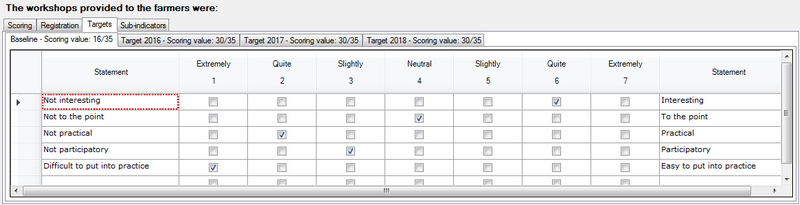
Beneficiary level monitoring:
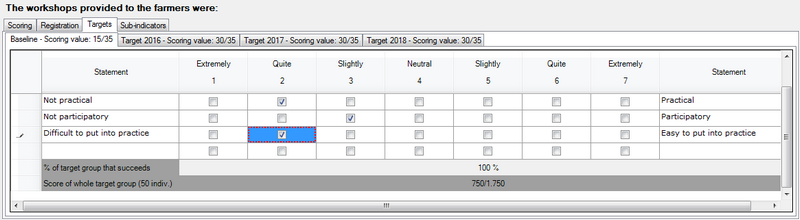
Scale (Thurstone)
The method of equal-appearing intervals or the Thurstone scale is used to measure attitudes of people. Logframer allows you to use a Thurstone scale to measure an indicator, but developing such a scale is not so simple.
This kind of scale is used to measure people's attitude towards a fairly clear and unidimensional concept, using a number of statements that vary in how they express a positive or negative opinion about the main concept. We'll briefly explain the steps of developing a Thurstone scale:
- Determine the focus: what concept are you going to measure (see what people's attitudes are toward it)?
- Ask a group of people (or a person) to write down different statements about this concept, reflecting different opinions or attitudes about the subject. Make sure you have a large number of statements, making sure that people can either degree or disagree with them (no - open - questions for instance).
- Rating the scale items: the next step is to have your group rate each statement on a 1-to-11 scale in terms of how much each statement indicates a favourable attitude towards the concept. The members of the group must not express their own opinion, they must only indicate how favourable they feel each statement is. You can use a scale with 1 = extremely favourable attitude towards the subject (focus) and 11 = extremely unfavourable attitude towards the subject.
- Compute the median and interquartile range for each statement. Create a table with these values and sort by the median.
- Select the items for the actual scale: you should select statements that are at equal intervals across the range of medians. Within each value, you should try to select the statement that has the smallest Interquartile Range. This is the statement with the least amount of variability across judges. You don't want the statistical analysis to be the only deciding factor here. Look over the candidate statements at each level and select the statement that makes the most sense. If you find that the best statistical choice is a confusing statement, select the next best choice.
- For a detailed example, see http://www.socialresearchmethods.net/kb/scalthur.php
You can now use the scale to measure attitudes 'in the field': enter the list of statements and use them to interview people or present them in a document. For each item, they should express whether they agree or disagree. The total score of a person is calculated by making the sum of the values of all the statements they agreed with, divided by the number of items he agreed on (in other words, the average of the statements they agreed with).
On the Scoring tab:
- Score values box: list the different statement to which the respondent can agree or disagree. Then enter a scoring value for each statement.
- Scoring: see the page on this topic
- Number box: select the number of decimals for the total scoring value of the baseline/targets. Since this total score is a division (the sum of the values of the agreed statements divided by the number of statements agreed on), you may want to choose for 1 or 2 decimals.
- Choices box: By default, agreement is expressed by ‘Agree’ and disagreement with ‘Disagree’, but you can change these options here.
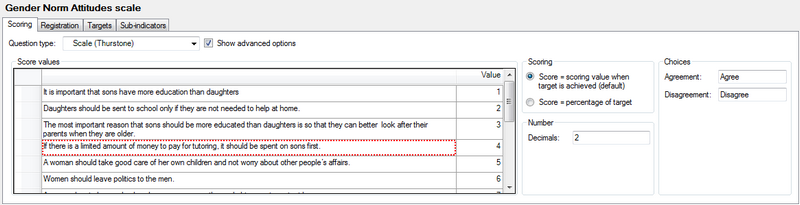
On the Targets tab:
- For each statement, click in the checkbox of the ‘Agree’ or the ‘Disagree’ column. The total scoring value is shown at the top of the column.
- When you measure at beneficiary level, specify which percentage of the target group you expect to reach that target. On the bottom row Logframer will calculate the total scores for the target population.
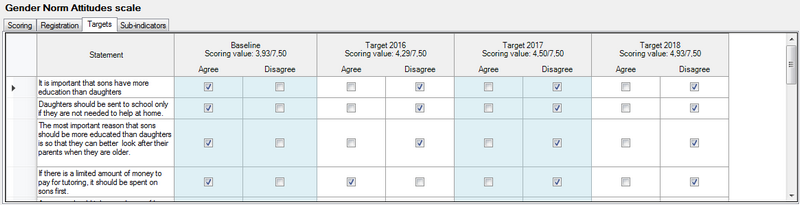
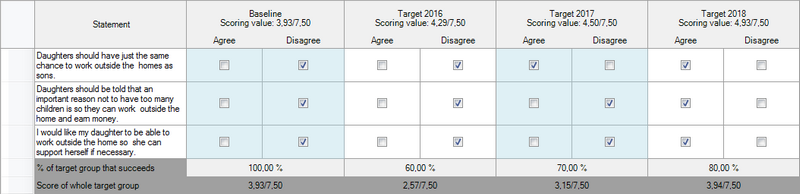
Likert scale
The difference between a full-blown Likert scale and a Likert-type scale is that the Likert-type scale only uses a five-point (or seven-point, or whatever you prefer) to answer on a single question. A full-blown Likert scale on the other hand uses a series of statements that explore different dimensions of a subject.
The Likert scale can also be used to measure attitudes of people. When responding to a Likert questionnaire item, respondents specify their level of agreement or disagreement on a symmetric agree-disagree scale for a series of statements. Thus, the range captures the intensity of their feelings for a given item. As with the Thurstone scale, the development of a Likert scale takes some effort.
A Likert scale uses a number of Likert items, which are statements to which a respondent expresses his agreement or disagreement. Generally, a five-point or seven-point scale is used, for instance:
- Strongly agree
- Agree
- Neutral
- Disagree
- Strongly disagree
As you can see, each item is bipolar: it measures either someone's agreement or disagreement to the statement and allows you to give some measure of how much you agree or disagree. There is a variety of possible response scales (5-point; 7-point; 4-point…). All of these odd-numbered scales have a middle value is often labelled ‘Neutral’ or ‘Undecided’. It is also possible to use a forced-choice response scale with an even number of responses and no central neutral choice. In this situation, the respondent is forced to decide whether they lean more towards the agree or disagree end of the scale for each item.
The basic steps of developing a Likert scale are:
- Determine the focus: what concept are you going to measure (see what people's attitudes are toward it)?
- Ask a group of people (or a person) to write down different statements about this concept, reflecting different opinions or attitudes about the subject. Make sure you have a large number of statements, making sure that people can express their degree of agreement or disagreement on a five or seven-point scale.
- Rating the scale items: the next step is to have your group rate each statement on your five-point (or seven-point, or 10-point) scale in terms of how much each statement indicates a favourable or unfavourable attitude towards the concept. The members of the group must not express their own opinion, they must only indicate how favourable or unfavourable they feel each statement is. All statements (Likert items) in the Likert scale must use the same number of points on the scale (so either a 5-point scale, or a 7-point scale, but not a mix of the two).
- Select the items for the actual scale: The next step is to compute the intercorrelations between all pairs of items, based on the ratings of the judges. In making judgements about which items to retain for the final scale there are several analyses you can:
- Throw out any items that have a low correlation with the total (summed) score across all items
- For each item, get the average rating for the top quarter of judges and the bottom quarter. Then, do a T-test of the differences between the mean value for the item for the top and bottom quarter judges.
- Correlation between the items and the total score: In most statistics packages it is relatively easy to compute this type of Item-Total correlation. First, you create a new variable which is the sum of all of the individual items for each respondent. Then, you include this variable in the correlation matrix computation (if you include it as the last variable in the list, the resulting Item-Total correlations will all be the last line of the correlation matrix and will be easy to spot). How low should the correlation be for you to throw out the item? There is no fixed rule here -- you might eliminate all items with a correlation with the total score less than .6, for example.
- T-test: Higher t-values mean that there is a greater difference between the highest and lowest judges. In more practical terms, items with higher t-values are better discriminators, so you want to keep these items. In the end, you will have to use your judgement about which items are most sensibly retained. You want a relatively small number of items on your final scale (e.g., 10-15) and you want them to have high Item-Total correlations and high discrimination (e.g., high t-values).
- For a detailed example, see http://www.socialresearchmethods.net/kb/scallik.php
You can now use the scale to measure attitudes in the field: enter the list of statements and use them to interview people or present them in a document. For each item, they should express to what degree they agree or disagree.
The final score for the respondent on the scale is the sum of their ratings for all of the items (this is why this is sometimes called a summative scale). On some scales, you will have items that are reversed in meaning from the overall direction of the scale. These are called reversal items. You will need to reverse the response value for each of these items before summing for the total. That is, if the respondent gave a 1, you make it a 5; if they gave a 2 you make it a 4; 3 = 3; 4 = 2; and, 5 = 1.
On the Scoring tab:
- Score values box: enter the different Likert scale options that the respondent will be able to choose from. A typical Likert scale has five or seven options (five-point Likert scale or seven-point Likert scale), which means that there is a neutral option in the middle. But you can also use an even number of options and use more or less options than five or seven. For example:
- Strongly disagree – disagree – neutral – agree – strongly agree
- Very good – good – bad – very bad
- Enter a scoring value for each option.
- Scoring: see the page on this topic
- Number box: select the number of decimals for the total scoring value of the baseline/targets.
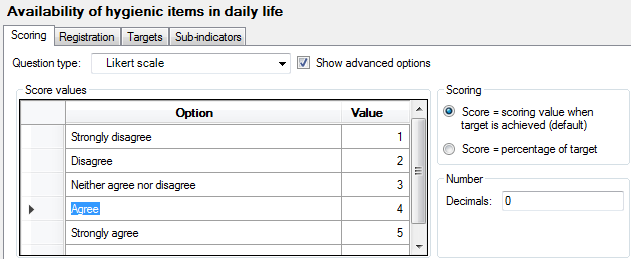
On the Targets tab:
- The Targets tab is divided in another series of tabs: one for the baseline and one for each target
- Add statements in the first column (Statement column). When you enter or modify statements in the Baseline tab they will automatically be copied to the targets.
- Select one of the checkboxes for each statement. The total score for the baseline or target is displayed in the tab header.
- When you measure at beneficiary level, specify which percentage of the target group you expect to reach that target. On the bottom row Logframer will calculate the total scores for the target population.
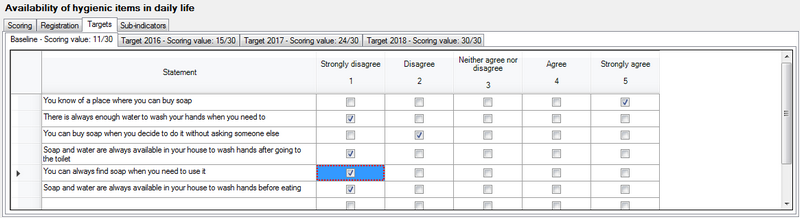
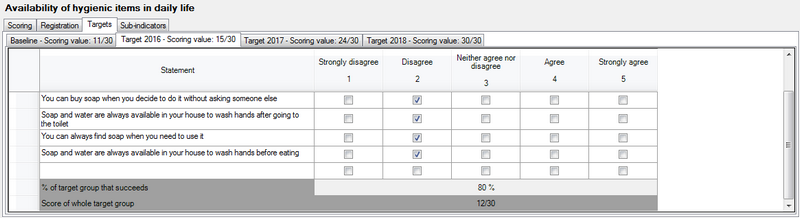
Cumulative scale (Guttman)
The cumulative scale or Guttman scale measures to what degree a person has a positive or negative attitude to something. It makes use of a series of statements that are growing or descending in how positive or negative a person is towards the subject. If for instance on a scale with seven statements the respondent agrees with the fifth statement, it implies that he or she also agrees with the first four statements, but not with statement number six and seven.
To create a Guttman scale, you need to:
- Determine the focus: what concept are you going to measure (see what people's attitudes are toward it)?
- Ask a group of people (or a person) to write down different statements about this concept, reflecting different opinions or attitudes about the subject. Make sure you have a large number of statements, making sure that people can either degree or disagree with them (no - open - questions for instance).
- Rating the scale items: the next step is to have your judges rate each statement, indicating whether the statement expresses a positive (favourable) or negative (unfavourable) attitude towards the concept. The members of the group must not express their own opinion about the concept, they must only indicate whether the statement is favourable or unfavourable.
- Developing the scale: construct a matrix or table that shows the responses of all the respondents on all of the items. Then sort this matrix so that respondents who agree with more statements are listed at the top and those agreeing with fewer are at the bottom. For respondents with the same number of agreements, sort the statements from left to right from those that most agreed to those that fewest agreed to.
- If there are lots of items, you need to use a data analysis called scalogram analysis to determine the subsets of items from our pool that best approximate the cumulative property. Then review these items and select the final scale elements. There are several statistical techniques for examining the table to find a cumulative scale.
- Because there is seldom a perfectly cumulative scale you usually have to test how good it is. These statistics also estimate a scale score value for each item. This scale score is used in the final calculation of a respondent's score.
- For a detailed example, see http://www.socialresearchmethods.net/kb/scalgutt.php
You can now use the scale to measure attitudes 'in the field': enter the list of statements and use them to interview people or present them in a document. For each item, they should express whether they agree or disagree. Each scale item has a scale value associated with it (obtained from the scalogram analysis).
To compute a respondent's scale score we simply sum the scale values of every item they agree with.
On the Scoring tab:
- Score values box: list the different statement to which the respondent can agree or disagree. Then enter a scoring value for each statement.
- Scoring: see the page on this topic
- Number box: select the number of decimals for the total scoring value of the baseline/targets.
- Choices box: By default, agreement is expressed by ‘Agree’ and disagreement with ‘Disagree’, but you can change these options here.
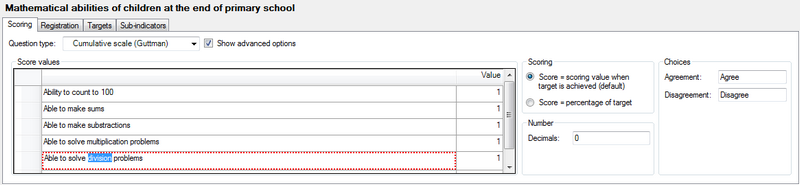
On the Targets tab:
- For each statement, click in the checkbox of the ‘Agree’ or the ‘Disagree’ column. The total scoring value is shown at the top of the column.
- When you measure at beneficiary level, specify which percentage of the target group you expect to reach that target. On the bottom row Logframer will calculate the total scores for the target population.
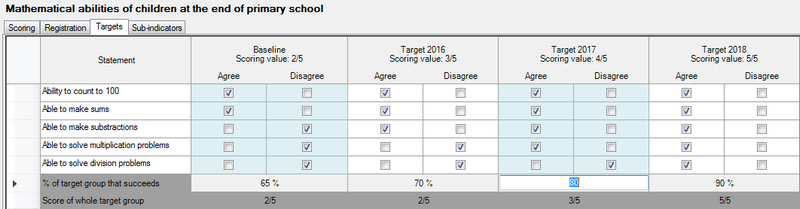
Frequency table - Likert scale
If you interview a whole group of people at a time or you work with total numbers of different groups (classes) of something, you may want to work with this version of the Likert scale. It works exactly as the Likert scale, but you enter numbers instead of checking options.
On the Scoring tab:
- Score values box: enter the different Likert scale options that the respondent will be able to choose from. A typical Likert scale has five or seven options (five-point Likert scale or seven-point Likert scale), which means that there is a neutral option in the middle. But you can also use an even number of options and use more or less options than five or seven. For example:
- Strongly disagree – strongly agree – neutral – agree – strongly agree
- Very good – good – bad – very bad
- Enter a scoring value for each option.
- Scoring: see the page on this topic
- Number box: select the number of decimals for the total scoring value of the baseline/targets. You can also select a unit from the list, or enter a new unit. If you enter a custom unit it will become available for all indicators in the current project (but not in other projects).
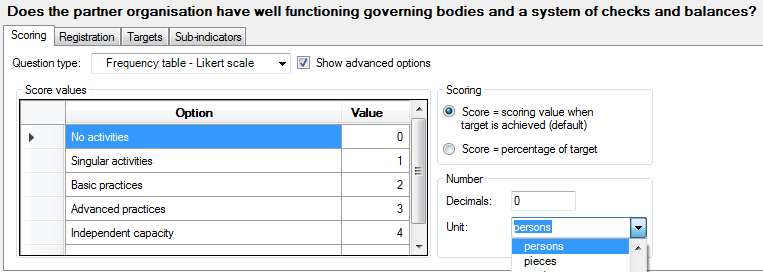
On the Targets tab:
- The Targets tab is divided in another series of tabs: one for the baseline and one for each target
- Add statements in the first column (Statement column). When you enter or modify statements in the Baseline tab they will automatically be copied to the targets.
- For each statement and each point on the scale, enter the number (frequency). The score for the statement is the median class (indicated in dark green). Logframer will also show the first and third quartile in light green, which means you can see the spread in the form of the Interquartile range.
- The total score (median and spread) for the baseline or targets is shown at the bottom of the table. The score is also displayed in the tab header.
- When you measure at beneficiary level, specify which percentage of the target group you expect to reach that target. On the bottom row Logframer will calculate the total scores for the target population.
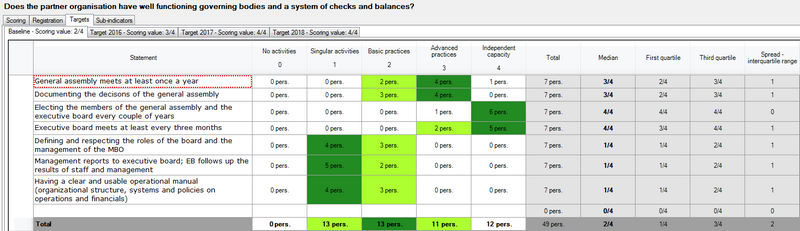
Images with targets
On the Targets tab:
- The baseline and targets are on separate tabs
- Click on Open document icon next to URL to select the picture that you want to open
- You can add a description of the picture
Tools for monitoring and evaluation
Logframer offers the following tools to design and manage your monitoring system:
- The Monitoring tool helps you manage your project using indicators to follow-up the progress and results
- You can create questionnaires based on your indicators that you can hand out or give to interviewers
- The Performance Measurement Framework gives an overview of the core components of your monitoring system
Tools: Monitoring tool
The Monitoring tool is a very powerful and interactive tool. It allows you to monitor your project for its entire duration, using the different types of indicators you've selected. Basically, you'll get a complete monitoring and evaluation system at one click of a button.
The Monitoring tool is a report that you can export to MS Excel. In the Import/export section of the File toolbar, click on the Create Monitoring Tool button.
You can select if you want to view all indicators or the indicators of a specific level (goals; purposes; outputs; activities). You can also select a specific target group, or the indicators for all target groups.
Note that it may take some time to export this report, especially if you have many indicators. When Logframer opens Excel, don't do anything in Excel (clicking in a cell etc.) because this will terminate the exporting process.
One final remark is that the different scales (Thurstone, Likert, Guttman) are only partially included, in the sense that you can only register the total scores. The actual tables with the statements and response scales are not included. The idea here is that you print the list of indicators, fill the forms out in the field and then you enter the results in this table.
Tools: Questionnaires
Underneath the usual settings of the Print Settings bar, you can set different options to select what information you want to include in the questionnaire.
You can select:
- Which indicators you want to include, meaning from which level of your logframe: impact indicators, outcome indicators, output indicators, activity indicators (progress indicators) or all indicators.
- To which target group the indicators belong: when designing indicators, you can set to which specific target group each indicator belongs. This way you can create different documents (questionnaires) for different target groups, only showing the relevant indicators for that specific group. Using the Target group setting, you can select any of the target groups you've identified, or else choose to include all target groups.
- Which type of information to include in the document:
- Purposes and outputs: if you uncheck these options, you will only see the actual questions (indicators) on your form. If you check them, they will be used as headers.
- Responses: if you check this option, you will get the options lists and space to enter the responses to the questions. If you uncheck this option, only the actual indicators will be listed.
- Value ranges and targets: if you check this option, the value ranges and targets will be included in curly brackets {}. If you include the value range, the person completing the list will be able to see what minimum and maximum values he or she has to respect. Including the targets is more for internal use - you probably don't want the respondents to know what the 'right' answer is.
Tools: Performance Measurement Framework
The Performance Measurement Framework is tool used for Results Based Management. It is a table that presents an overview about:
- The expected goals, purposes or outputs
- How you will follow-up progress (indicators)
- The target type: score/beneficiary or of the whole target group
- The baseline and targets
- What data sources (verification sources) you will use
- How you will collect data
- At what frequency
- Who's responsible for the data collection.
The Performance Measurement Framework is a report that you can either print or export to MS Word or MS Excel.
You can select if you want to view all indicators or the indicators of a specific level (goals; purposes; outputs; activities).
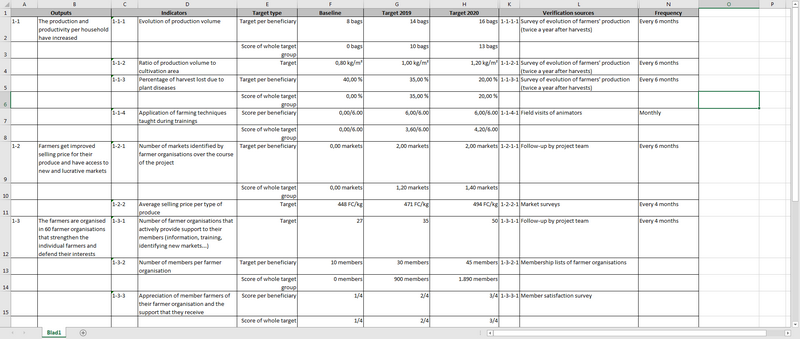
Verification sources
The Verification Sources column is the third column of the logical framework. The verification sources describe where you (or an external evaluator) can find the information necessary to verify your indicators. For each indicator you can specify one or more verification sources. With multiple verification sources you can triangulate data: verify if the data is accurate by comparing different sources.
Click on a verification source in the logframe to get the following Verification Source Detail panel:
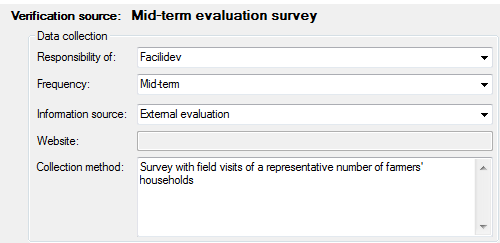
Here you can indicate how the data will be collected, and who will be responsible for the collection of this information.
- Responsibility of: To indicate who is responsible for the data collection, you can select any of your partners from the drop-down list.
- Frequency: you can indicate the frequency at which the data collection should happen: weekly, monthly, every 3-4-6 months, yearly, at the start or at the end of the project, mid-term, before the project starts (ex ante) or after the project (ex post).
- Information source: indicate what kind of information source you're using: a baseline study, registration forms, follow-up missions, meetings, etc.
- Website: If you've selected a website as your information source in the previous box, you can enter the site's URL here.
- Collection method: here you can provide a bit more information about the collection method
Planning activities, processes and key moments
To design the planning overview of your project, select the Planning tab.
The Planning window allows you to plan the project's key moments, processes and activities. Using the Details pane you can also specify additional information. This in turn will allow you to design specific tools:
|
Main window |
Details pane |
Tools |
|
Key moments |
Relation of key moment to other key moments or activities (1) |
|
|
Processes |
Who organises and where (1) |
|
|
|
Child activities (1) |
|
|
Activities & sub-activities |
Relation of activity to other key moments or activities (1) |
|
|
|
Duration of activity (1) |
|
|
|
Who organises and where (1) |
|
|
|
Preparation and follow-up periods (1) |
|
|
|
Repeating activities (1) |
|
(1) You can also do this in the Logframe window. In the Details pane of the logframe you can modify dates, durations and so on, but in the Planning window you have drag-and-drop functionality.
The difference between key moments and activities is that key moments don’t have a duration. They are more like deadlines or mile-stones.
Activities have:
- A duration and therefore a start and end date
- An optional preparation period
- An option follow-up period
- An activity type that you can specify (meeting, planning, audit, report, travel…)
- You can specify who will organise the activity and where
Activities can have child activities. In that case the parent activity becomes a process and its start and end dates (duration) depend on the start and end dates of its sub-activities.
Linking activities and key moments
There are two ways to set the (start) date of a key moment or activity:
- You can set an exact (absolute) date. This means that the activity or key moment is not linked to any other activity or key moment. If your project is postponed with three months and you change its start date, any activity or key moment with an exact date will not move as well.
- You can set a relative date: this means that you indicate that the activity or key moment will start so long before or after another activity or key moment. The most important and most frequently used key moment to refer to is the project's start date. This means that if your project is postponed with three months and you change its start date, all activities and key moments with a relative (linked) start date will move as well.
Apart from the project's start and end date, you can link an activity or key moment to any other activity or key moment. Blue arrows show which activities and key moments refer to a certain key moment. Black arrows show which activities or key moments refer to a certain activity. You can show or hide these arrows using the Lay-out toolbar: in the View section click on the Links to key moments or Links to activities button.
Linking activities / key moments using the planning window
To link activities / key moments using the planning window (drag-and-drop):
- In the Items toolbar, click on the Link button on the far right.
- Hover the cursor over a key moment, or over the start or end of an activity bar. The cursor will turn into a cross.
- Left-click and drag from the key moment/activity you want to refer to, towards the target key moment or activity (start/end of the activity). While you drag, you will see an arrow.
- Release your left mouse button. You will see a blue or black arrow to indicate that the two items are linked.
- If you check the Details pane, you will see that the first option is selected and that the fields are completed to ‘1 days after the activity or key moment in question’.
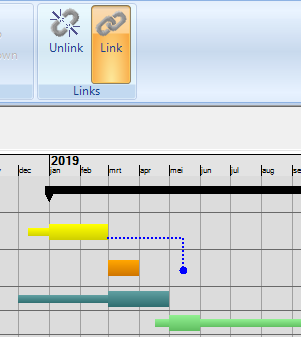
Unlinking activities / key moment using the planning window
To unlink activities / key moment using the planning window (drag-and-drop):
- In the Items toolbar, click on the Unlink button on the right.
- Click on the target activity/key moment. You will see that the blue / black arrow disappears. The location of the activity/key moment will not change however.
- If you check the Details pane, you will see that the second option is selected and that the relative date has been changed into an exact date.
Setting a relative date using the Details pane
To set a relative date using the Details pane:
- Key moment: click on the key moment in the Planning window and in the Details pane make sure that the first option is checked. Then:
- Enter the number of days, weeks, months, years…
- Select the time unit from the drop-down list
- Use the drop-down list to indicate if the key moment comes before or after the referenced activity/key moment
- Use the last drop-down list to select a key moment or activity. You can reference to the project's start or end date, or any other key moment or activity.
- Activity: click on the activity in the Planning window. Select the Duration tab if it's not visible in the Details pane. Make sure that the first option is checked (‘At this exact date’). Then set the period between the activity and the other activity or key moment in the same way as described above.
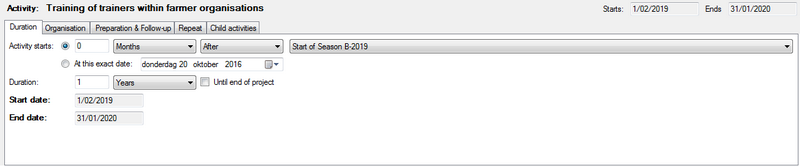
Setting an exact (absolute) start date
To set an exact (absolute) start date:
- Key moment: click on the key moment in the Planning window and in the Details pane make sure that the bottom option is checked (‘At this exact date’). Then use the date selector to set the date of the key moment.
- Activity: click on the activity in the Planning window. Select the Duration tab if it's not visible in the Details pane. Make sure that the bottom option is checked (‘At this exact date’). Then use the date selector to set the date of the Activity.
Activity settings in the Details pane
The Activity Detail pane allows you to set the start date and duration of the activity, indicate who will organise it and where; determine how long you will need to prepare or follow-up the activity; and how many times you need to repeat the activity.
There are five tabs available:
- Duration tab: when will the activity start and how long will it take?
- Organisation tab: who will organise it and where? What type of activity is it?
- Preparation and follow-up tab: if necessary, you can specify how much time you will need to prepare and to follow up the activity
- Repeat tab: you can repeat an activity and specify how many times you want to repeat it and if you need to prepare and follow-up each time.
- Child activities: if the activity is a process and has sub-activities, they are listed here. In that case, the Duration and Repeat tab will not be visible.
Duration tab
Duration tab settings:
- Select a relative date or an exact (absolute) date using the radio buttons
- To set a relative date:
- Select the top radio button
- Enter the number of days, weeks, months, trimesters, semesters or years
- Select ‘days’, ‘weeks’, ‘months’, ‘trimesters’, ‘semesters’ or ‘years’ from the left drop-down list
- Select ‘After’ or ‘Before’ the key moment in question using the centre drop-down list
- Select a key moment or activity from the right drop-down list
- To set an absolute date:
- Select the bottom radio button
- Enter the date or use the date selector (press on the little downward facing arrow) to choose the date
- Duration:
- Enter the number of days, weeks, months or years
- Select ‘days’, ‘weeks’, ‘months’, ‘trimesters’, ‘semesters’ or ‘years’ from the left drop-down list
- You can check the ‘Until end of project’ box on the right. Logframer will then calculate how many days/weeks/months/years remain until the end of the project and set the number. Note that only whole numbers can be used, so if you've selected weeks, months, trimesters, semesters or years the activity may not take until the very last day of the project. If you want to make sure the activity lasts until the very last day, make sure to select ‘days’ from the drop-down list.
The actual start date will and end date of the activity will appear in the top-right corner of the pane, as well as on the bottom of the Duration tab.
Organisation tab
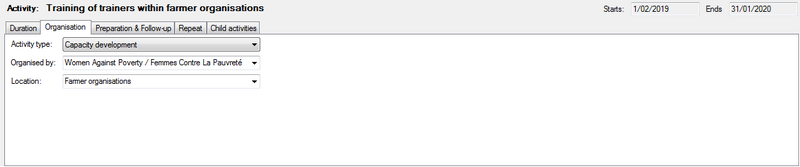
Organisation tab settings:
- Choose an activity type from the drop-down list. The colour of the activity in the Gantt chart will change according to this setting.
- Organised by: select one of your partners from the drop-down list, or type the name of another organisation or person.
- Location: select a location from the drop-down list or type a new one.
Preparation and follow-up tab
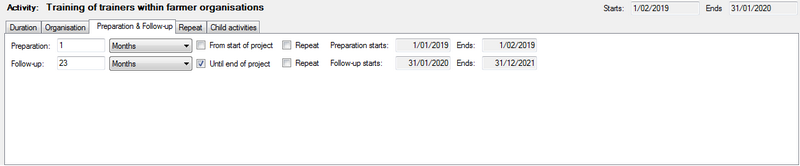
Preparation and follow-up tab settings:
Preparation and follow-up periods can be identified for every activity, but they are totally optional.
- Preparation:
- Enter the number of days, weeks, months, trimesters, semesters or years
- Select ‘days’, ‘weeks’, ‘months’, ‘trimesters’, ‘semesters’ or ‘years’ from the drop-down list
- Check the ‘From start of project’ box to make sure that the preparation period starts as soon as your project start. Note that only whole numbers can be used, so if you've selected weeks, months, trimesters, semesters or years, the preparation may not start on the very first day of the project. If you want to make sure the preparation starts the very first day, make sure to select ‘days’ from the drop-down list.
- If the activity will be repeated, check the Repeat box if you want to repeat the preparation as well. If you only need to prepare for the first time alone, leave this box unchecked.
- Follow-up:
- Enter the number of days, weeks, months, trimesters, semesters or years
- Select ‘days’, ‘weeks’, ‘months’, ‘trimesters’, ‘semesters’ or ‘years’ from the drop-down list
- Check the ‘Until end of project’ box to make sure that the follow-up period ends when the project ends. Note that only whole numbers can be used, so if you've selected weeks, months, trimesters, semesters or years, the follow-up may not end on the very last day of the project. If you want to make sure the follow-up does end on the very last day, make sure to select ‘days’ from the drop-down list.
- If the activity will be repeated, check the Repeat box if you want to repeat the follow-up period as well. If you only need to follow-up after the first time, leave this box unchecked.
Repeat tab
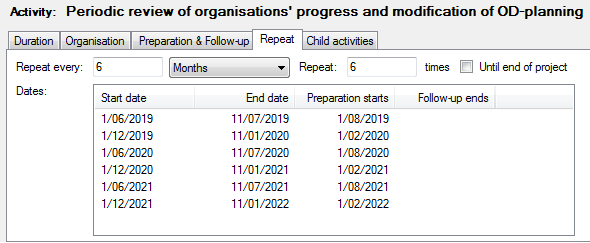
Repeat tab settings:
If you have a repeating activity, you can make use of these settings. Repeating an activity is optional, so in most cases you won't have to fill out this information.
- Repeat every: enter a number of days, weeks, months, trimesters, semesters or years
- Select ‘days’, ‘weeks’, ‘months’, ‘trimesters’, ‘semesters’ or ‘years’ from the drop-down list
- Enter the number of times you want to repeat the activity
- If you want the activity to be repeated until the end of the project, check the ‘Until end of project’ box
Once you've set the repeat settings, the Dates list will give you an overview of how many times and when exactly the activity will take place.
Child activities tab
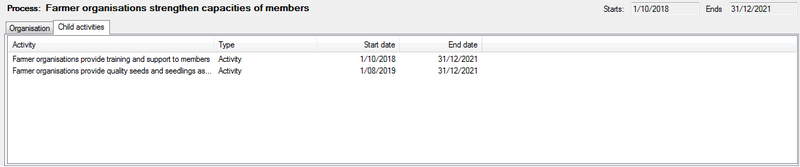
You can use this tab to add, edit or remove child activities, using the Items toolbar (click into the list view first).
Once you've added a child activity, the activity becomes a process. This means that its duration will be determined by the duration of the child activities. As a consequence, the Duration, Preparation & Follow-up and Repeat tabs will not be visible any more.
You can also add, edit or remove child activities using the main planning window.
Key moment settings in the Details pane
Here you can change the following information:
- Enter or modify the description of the key moment in the Description field
- Select a relative date or an exact (absolute) date using the radio buttons
- To set a relative date:
- Select the top radio button
- Enter the number of days, weeks, months or years
- Select ‘days’, ‘weeks’, ‘months’ or ‘years’ from the left drop-down list
- Select ‘After’ or ‘Before’ the key moment in question using the centre drop-down list
- Select a key moment or activity from the right drop-down list
- The actual date will appear on the right
- To set an absolute date:
- Select the bottom radio button
- Enter the date or use the date selector (press on the little downward facing arrow) to choose the date
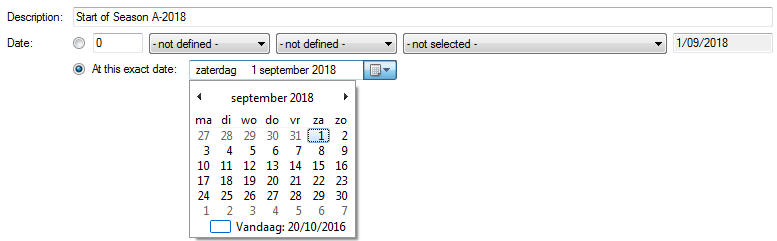
Tools: Project Planning
You can print the planning or export it to MS Word. The print version gives you the most detailed view. The MS Word version is a basic version with a general overview of the key moments and activities per month in a table for each year of the project.
In print preview you can select for which outputs you want to see the planning, and whether or not you want to see both activities and/or key moments. You can also set the level of detail (days – weeks – months – trimesters – semesters – years).
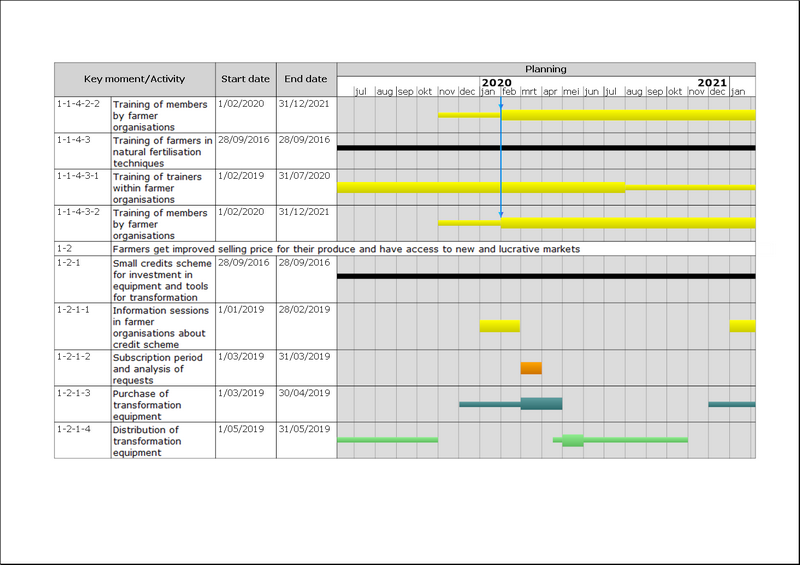
Making the Budget
To design the budget of your project, select the Budget tab.
You have a choice between two types of budget:
- A simple budget: this means you have one (big) list of budget headers and budget costs.
- A multi-year budget: for every year of the project you can specify costs. Logframer will create a tab page for every budget year, preceded by a Total budget page. You can determine the overall structure of your budget on the Total budget page and this structure will be used on the other pages.
Once you've designed your budget, you can go back to the logical framework and determine for each activity what the cost of the resources will be. For every resource you can list which budget items will be used, and which percentage of the price of each budget item.
In the Budget Details pane you can see an overview of the activities and resources that have used the current budget item and what percentage they have used. This also allows you to see if budget items haven't been overused.
Making a simple budget
In the Lay-out toolbar, verify in the Structure section that the Simple budget button is selected.
A simple budget has only one (tab) page and is not split up in different budget years.
Creating a multi-year budget
In the Lay-out toolbar, verify in the Structure section that the Multi-year budget button is selected. Logframer will create a tab page for every year of the project. The first page of the budget is the Total budget page.
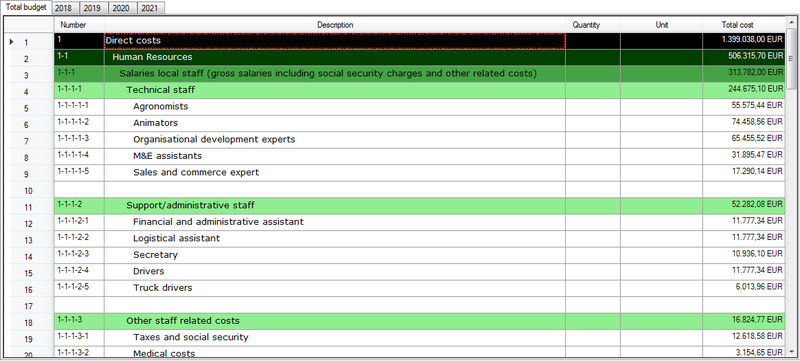
The structure of a multi-year budget is as follows:
- You define the different budget headers on the Total budget page.
- These headings are copied on the pages of the year budgets
- For each year budget, you add budget items to each of the budget headers.
- The totals of the budget years are calculated and displayed on the Total budget page
This means that there are common budget headers for the whole of your budget. But within each budget year, you have the flexibility to add any items you want. You can even add additional budget headers specifically for one budget year that you won't (re)use for the other years.
Note that if you remove a budget header on the Total budget page, all the sub-items on the different budget year pages will also disappear.
To make creating a multi-year budget easier, it's best to follow these steps:
- Create the structure of your budget with all the headers that must be used for the different budget years in the Total budget page
- Fill out the first budget year as much as you can, adding individual items and their costs
- Copy the information from the first budget year to the following budget year(s):
- Click in any cell of the second budget year
- In the Items toolbar, click on Copy values from previous year (in the References section on the right).
- Repeat to other years if necessary
- Modify where necessary in the individual budget years
Working with different currencies
By default, the budget of your project uses one main currency, which you can select in the Preferences dialogue or in the Exchange rates pane. But if the unit prices are in local currency, you can use these numbers and then do an automatic conversion.
Before you can use an additional currency, you must add it to the list of currencies and exchange rates. Then in the budget overview, you have to unhide the Local Currency columns.
Managing currencies and exchange rates
In the Lay-out toolbar, click on the Exchange rates button to show the Exchange rates pane on the right of your screen.
On top of the pane, you can select the default currency for the project. Logframer uses ISO 4217 currency codes.
Use the table below to add additional local currencies:
- Select the name of the currency in the first column using the drop-down list
- Enter the exchange rate in the second column. When you leave this cell you will see conversions between your default currency and the local currency.
You can add as many local currencies as you want.
Use local currencies in your budget
In the Lay-out toolbar, click on the Local currency button in the Columns section.
The Currency column will become visible to the right of the Cost/unit column. For each unit cost, you can specify the local/default currency to use. Next you'll find the Total in local currency column and finally the Total cost column with the amount in the default currency (using the exchange rate you set in the Exchange rates pane).
If you use a multi-year budget these additional columns will be visible on the tab pages of the different budget years, but not in the Total budget. All amounts in the Total budget are expressed in the default currency.
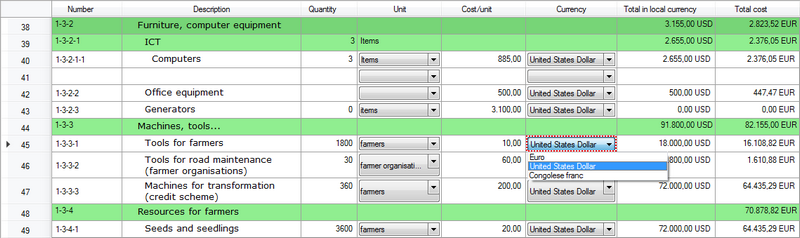
Budget templates
To make designing your budget easier, Logframer has a number of budget templates:
- Direct/Admin cost: very often budgets have two big blocks:
- the direct costs (working costs) with the actual costs of the activities, the staff costs, investments costs and so on
- the administration costs (indirect costs): calculated as a percentage of the direct costs and destined for overhead costs of the (head) office.
- Humanitarian budget templates:
- ECHO (European Commission Humanitarian Office)
- DFID (Department for International Development – UK
- CIDA (Canadian International Development Agency)
- Budget templates for Development assistance:
- EuropeAid (European Commission development agency)
If you click on one of the buttons of the Structure section of the Lay-out toolbar, Logframer will prepare the budget template for you. Some of these templates are multi-year templates, while others are simple templates.
Disclaimer: Facilidev does not guarantee the correctness/completeness of these templates and their compliance with the legal requirements and/or donor requirements of the organisations and instances mentioned above. These templates are designed as examples to assist you in developing more complex budget formats. Before you use these templates to develop and present your project proposal and financial proposal to any donor, you must verify that it complies to all the (legal) requirements of that donor at the time of your deposit. Be aware that donors may deviate from standard templates in specific cases.
In no case Facilidev or the developer team of Logframer can be held accountable for any failure to obtain donor funding by using these templates or the Logframer software.
Tools: Project Budget
You can print the budget or export it to MS Excel.
You can select which budget years you want to print or export. In print preview, you can also hide or show the duration columns and the local currency column. You also have the option to print the exchange rates in a separate table below the budget.
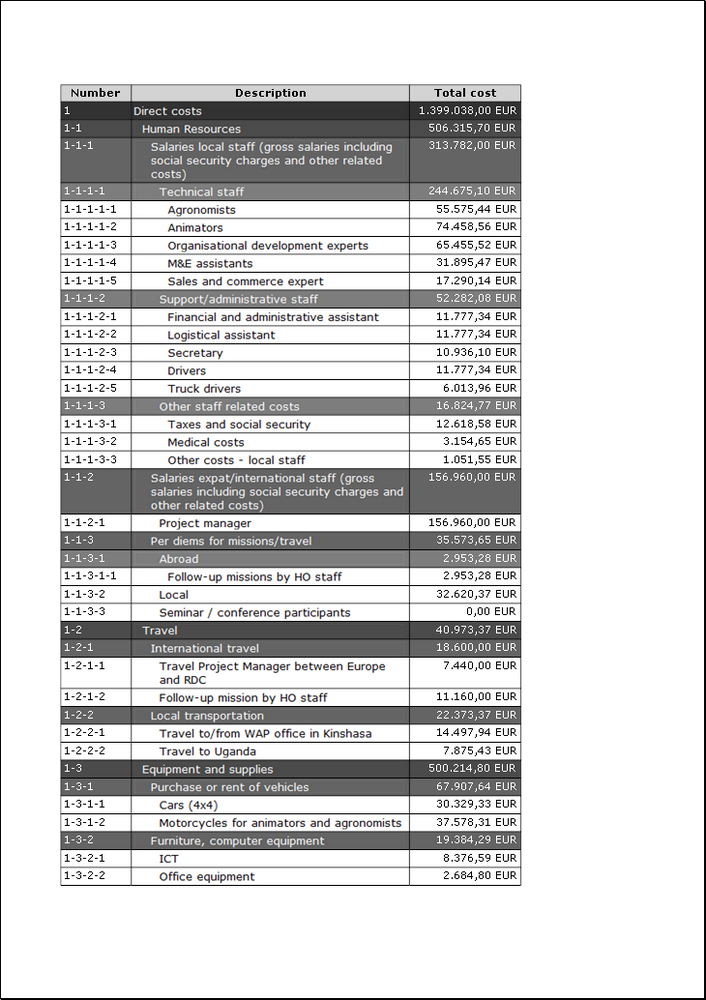
Overview of necessary resources
For each activity or process you can identify one or more process indicators and specify one or more necessary resources. In the logframe you can see one type of information, but you can switch to the other at any time.
If you scroll down to the Activities section and you see (process) indicators, select the Lay-out toolbar and in the Structure section on the right click on the Resources & budget button.
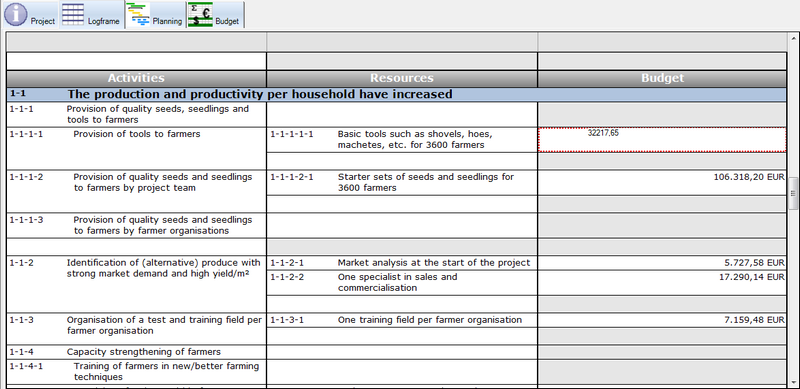
Resources with an indicative cost
For each activity or process, you can specify one or more resources. To do so, click in the empty cell next to the activity (in the Resources column) and describe the resource.
If you merely want to give an indicative cost for this resource, you can click in the cell to the right (in the Budget column) and enter the cost of that resource.
Alternatively, you can work in a more precise way and select items from the budget.
Linking resources and budget
If you want to calculate a more precise total amount for the resource in question, you can use the Resource Detail pane.
Before you can select items from your budget, you (naturally) have to establish your project's budget first.
In the logframe, click on the resource in question. In the Resource Detail pane, you will get the following table:
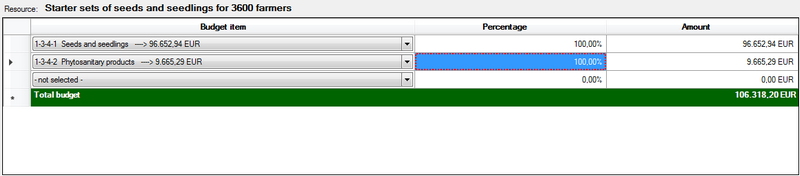
- In the Budget items column, select a budget item or heading from the drop-down list. Note: if you have a multi-annual budget, you can only select items from the Total budget page.
- In the Percentage column, enter the (approximate) percentage of the budget that you will need to use for this resource. You will see the final amount in the Amount column.
- Alternatively, you can enter the amount in the Amount column and then Logframer will calculate the percentage.
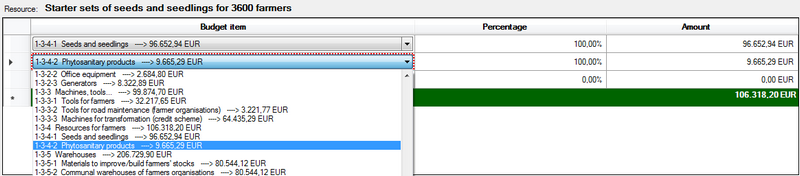
Select as many budget items as you want. The total amount will be shown in the Budget column of the logframe. If you've entered an indicative figure there, it will be replaced by the calculated total of the budget items that you selected.
This way you can establish a clear link between your activities, objectives and budget. This will allow you to show for each output how much money you intend to spend. You can do this by printing the Resources table.
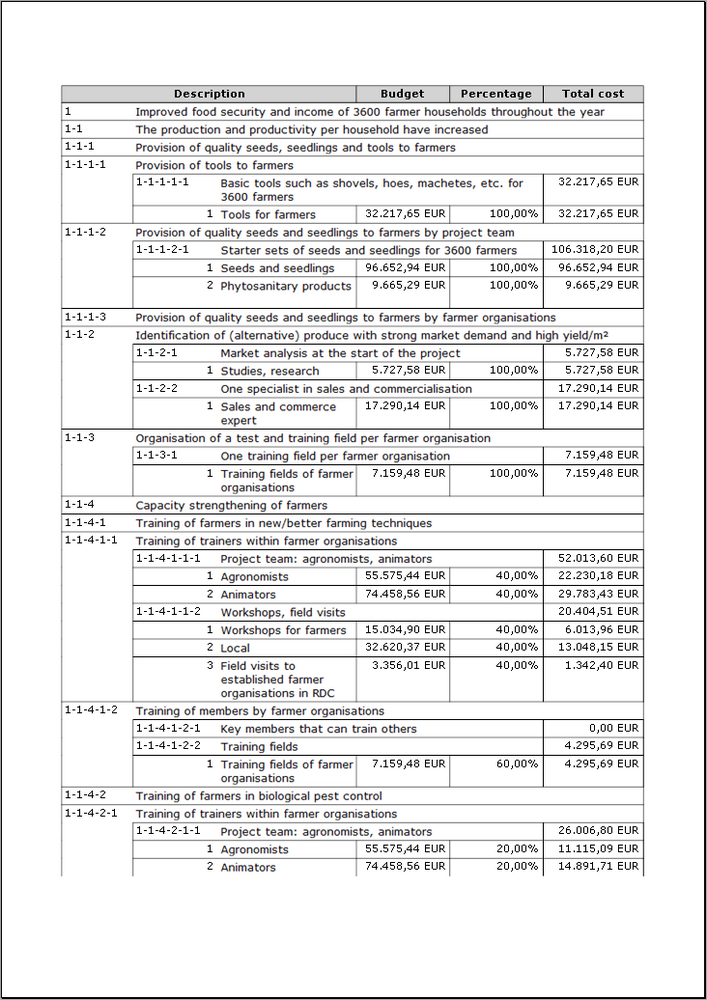
Aid transparency with IATI

IATI or the International Aid Transparency Initiative is a global attempt to make aid delivery and the fight against poverty more effective through the sharing of information. IATI tries to provide a good overview of what kind of aid is delivered (or will be delivered) at different places by different actors. These actors can include governments of both the donor and recipient countries, international NGOs, local NGOs, companies, non-profit organisations, faith-based organisations, individual initiatives...
To make aid delivery effective to a country or region effective, it is important to have a common strategy and vision so that different initiatives work complementary to each other and reinforce each other. This is necessary for instance to avoid that everyone starts working on the same spot, hindering each other and pouring too many resources in one location, while people in other locations remain in dire need for assistance.
In order to enable developing countries to coordinate and plan the different efforts that will take place in their territory, it is vital that they know who wants to do what where and when. At the moment this is very difficult, as there are many sources of information and not every organisation informs local authorities about what they want to do - although in some countries there may be very good reasons to avoid government interference.
The second goal of aid transparency is to offer citizens, civil society organisations, journalists, scientists, etc. information about where the funds - provided by government agencies or by private donations - go to. Who is involved in the transferring and spending of this money? Where does it end up? What did it buy? Who received it? What changes did it bring about? Were the projects successful?
To allow for this exchange of information, a common standard was needed for (digital) information exchange. This means that when someone sends you information about a project, this information is structured in a specific way so that both the software at the sending and the receiving end agree about where to find the title of the project, the financial information, the location of the project, the results of the project and so on.
The IATI standard is an internationally agreed standard of information exchange about aid delivery. It is a XML document (similar to HTML which is used to create web pages) and it lists a number of field names and each field contains text or a value. In essence, these XML documents are text documents that can be created with different instruments: an ordinary word processor, special Excel templates (offered by IATI), specialised software such as Aidstream or web services that connect one organisation's database with another (API).
Since version 3.0, Logframer supports the creation, reading and updating of IATI files.
For more information about the IATI initiative, visit their website at http://www.aidtransparency.net/
In this section of the manual we'll treat the following topics:
- What are the main IATI instruments: registry, datastore and d-portal
- IATI documents according to the IATI standard: activity files and organisation files (and how to create them)
- Overview of the process: registering, creating files, publishing the files on your site, registering the files in the Registry
- How to create an organisation file in Logframer
- How to create an activity file in Logframer
- Validating files
- Opening and updating files
IATI instruments
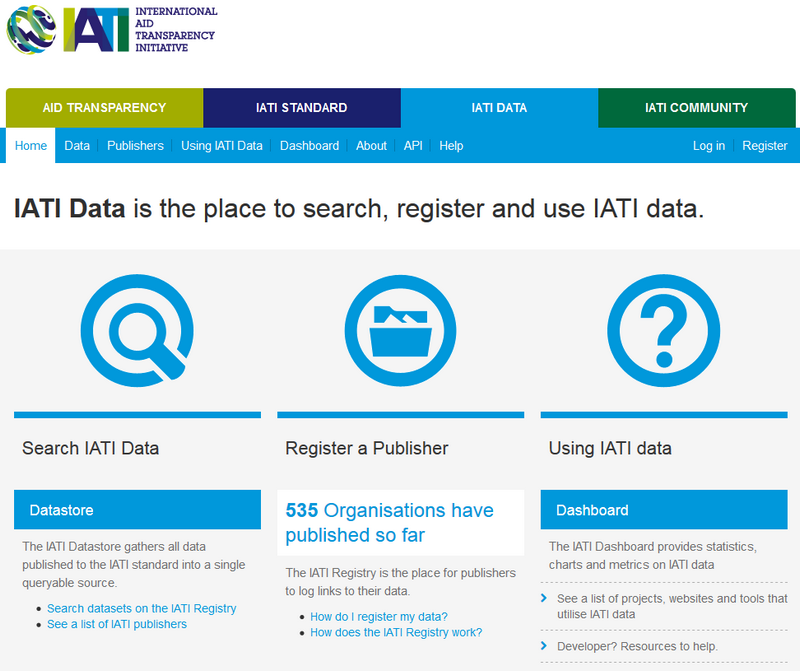
The central element in the IATI concept is the Registry. This is where you can find all the organisations that publish information in IATI format, as well as the activities that they are doing. The registry does not contain all the information about development and humanitarian aid initiatives. Instead, it is a list of organisations and for each organisation a list of the (XML) files they have produced and where you can find them. The actual IATI documents can be found on the websites of the different government agencies, NGOs, volunteer groups, etc. that have joined the IATI initiative (and that have registered). While anyone can produce and share IATI documents, the registry is what enables people or organisations all over the world to find that information.
However, hopping from one website to the other to open IATI documents can be tedious and the files will only tell you what each individual organisation does. To get an overview of what is done by different donor countries or what happens in a specific country or region (activities of different organisations), you can use the Datastore. The Datastore visits the websites of the registered organisations, reads the information from the IATI documents and brings it together in a database that you can query.
Another instrument to explore IATI data in a more visual way is D-portal. This tool is still in a development phase and tries to explore the different possibilities to learn from the IATI data.
IATI documents
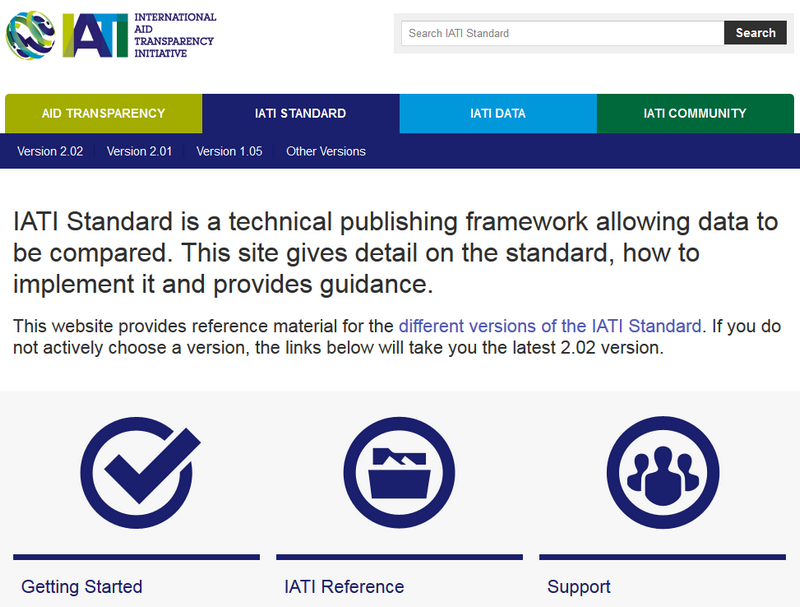
IATI documents are XML text documents that are structured according to the IATI standard. There are two types of documents:
- IATI organisation documents contain mostly financial information about the organisation as a whole. Registered organisations are asked to produce an Organisation document at least once a year, with information about their expenses over the last three years and their budget forecast for the next three years. IATI asks you to provide high-level information (the main budget or expenditure headings of our organisation), so in essence what you would publish in the annual report that you put on your website or publish in a paper document.
- IATI activity documents contain information about projects or programmes. They contain information about the duration of the project, its location, who participates, who benefits, what sums were received, transferred and spent, what results were envisaged and achieved, etc. An IATI activity document can contain information about a single project or about a series of projects (all the projects that your organisation did in the year 20xx).
In principle you can set about creating an IATI document using nothing but a word processor (MS Word, Notepad...) and the guidelines of the IATI reference (the Organisation standard or the Activity standard). However, the standard isn't exactly easy reading if you don't know what you're doing (if you're not familiar with XML mark-up language) and in the end you may produce a document that cannot be validated.
There are different tools available to produce IATI documents, which are much easier to use:
- Logframer is able to produce both IATI Organisation and IATI Activity files in the current version of the standard (2.02). Moreover, Logframer is also able to open (and edit) existing IATI documents in the current or any previous versions of the standard. The biggest advantage of Logframer may be that you don't have to do anything special to create your files, meaning that you don't have to copy information from other documents to your IATI document. You just develop your project and then with the press of a button you get your IATI activity file. Logframer allows you to create an IATI file for a single project, or one file containing multiple projects.
- Aidstream is an online tool to create both IATI Organisation and and IATI Activity files. It is pretty straightforward to use and guides you through the whole publishing process. You can register your files directly from within Aidstream, which means you don't have to login separately into the IATI register. As a web interface it can work a bit slower because web-pages have to refresh. Aidstream allows you to enter information about every element of the IATI standard. Aidstream allows you to create an IATI file for a single project, or one file containing multiple projects.
- The IATI secretariat also offers a number of Excel (CSV) templates that you can use to create xml-files. These are good if you want to register basic information about your projects, but they can't handle every element of the standard. Also, in some cases you need to repeat information (when registering transactions for instance).
- The last possibility is to transfer information directly from your project database or ERP system to the register and to IATI files using a web service (API). To start with, this means that your organisation needs to have such a database and that it contains all the necessary informations. Secondly, you'll have to make a custom-made solution for your database, which means you'll need to make a bigger investment. On the other hand this is certainly worth it if you are a big organisation with many, many projects, because the alternative would be to re-enter all that information manually in Aidstream for instance. For more information, see: https://www.iatiregistry.org/registry-api
Overview of the process
You can start producing IATI files right off the bat, but the idea is of course that they can be found easily by anyone looking for information. In order to do that, your organisation has to become a registered publisher and then each time you produce a new file you have to enter it in the IATI registry.
- Register your organisation: if you are new to IATI you will have to create a new personal account first. Then you can register your organisation. You have to provide some basic information about your organisation and apply for membership. Once your application is approved (which doesn't take long) your organisation is now an official Publisher. More information about how to become a registered Publisher can be found here: https://www.iatiregistry.org/help
- Create files: as explained before, there are two types of files:
- Create an organisation file: this contains mainly financial information about your organisation's main expenditure (during the past three years) and its projected budget (for the next three years).
- Create one or more activity files: you can choose whether you want to create a single activity file with all your organisation's activities (projects/programmes) or one file per activity. Other possibilities are to create a file grouping activities within a single region or around the same topic for instance.
- Publish the files on your website: create a folder somewhere on your website and post the IATI xml documents in that location. Make sure that this location is publicly accessible.
- Register any newly published files in the IATI Registry
As you can see the whole process is relatively simple. The hard part is actually to prepare your organisation. Before you start publishing data on the world wide web you need to be sure that you have a clear idea of what you want to share, how this may affect your organisation (identify any risks), what this will mean in terms of workload and how you will organise yourselves to bring all the information together. The technical process may be simple, but aid transparency is something fundamental that requires a clear commitment and participation of the whole organisation.
How to create an organisation file
To make a new organisation file, start up Logframer or click on New project in the File toolbar if you have another project opened in Logframer.
Still in the File toolbar, go to the Mode section and click the IATI organisation button. You will see this on your screen:
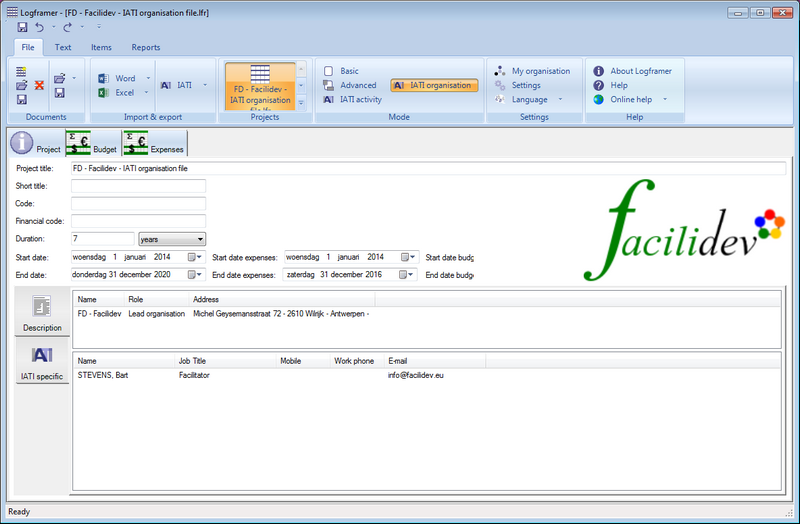
As you can see, in IATI organisation mode you can't work with the logframe or with the planning. The IATI organisation file focuses mainly on financial information and nothing much else. This means that apart from the Budget window, you also get a new Expenses window.
If you have registered information about your organisation in the My organisation dialogue, Logframer will automatically add this information in the Partner list. Since the purpose of the IATI organisation file is to report on your own organisation, it's best not to add any other partner organisations here.
In terms of IATI specific information there is not much to add. The only thing you can include is document links, to year reports for instance.
Setting the duration options
For an IATI organisation file, additional fields will appear in the Project Information window next to the start date and end date of the project (or in this case the organisation file).
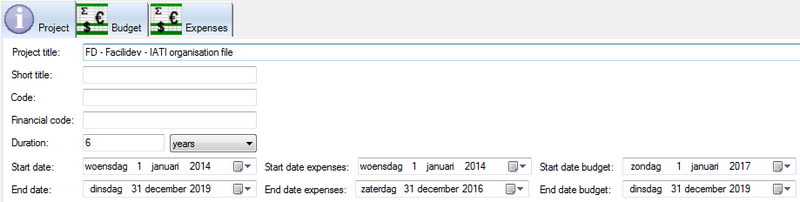
IATI guidelines stipulate that for the organisation file, you would specify the expenses of the last three years and the budget forecast for the next three years. When you create a new IATI organisation file, Logframer will automatically set the following duration settings:
- For the duration of the project: project start date three years before the current year (on the first of January) and end date on the 31st of December of the year two years from now (see example). So the duration of the project is a period of six years.
- Start date expenses: three years before the current year
- End date expenses: end of the previous year
- Start date budget: beginning of the current year
- End date budget: three years later (this year + 2)
You are not obliged to follow the 3-year rule, but it is recommended by IATI. If you want to change the default settings you can.
Adding expenses
IATI asks you to present your organisation's total expenses over the last three years. You can make do with a total figure, or you can add some detail according to your own liking. The idea here is to be transparent about your main expenses, but it's not necessary to go into much detail or replicate your bookkeeping here.
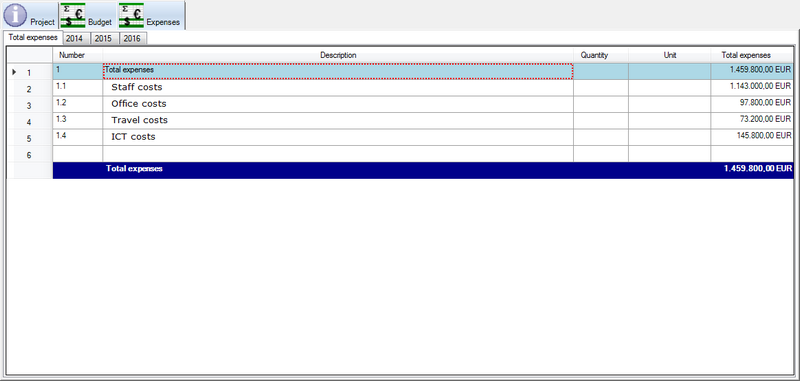
On the Total Expenses page, you can specify which main expenses you want to calculate. Apart from filling out the Description column you don't have to do anything else. Logframer will calculate the numbers for you.
Next go to the first year and detail the costs. How far you go is entirely up to you and depends on your transparency policy. You can provide lump sums or detail duration, quantities and unit costs.
Once you've completed the first year you move to the next. If the costs are more or less the same you can start by copying the headings and values from the previous year. Go to the Items toolbar and click on the button that says Copy values from the previous year. This will save you some manual labour, all you have to do now is to update values where necessary.
Adding the multi-year budget
IATI asks you to present your organisation's budget for the next three years. Unlike the expenses, there are a number of different figures that you need to specify:
- Your organisation's total budget for each year
- The total budget that will go to recipient organisations
- The total budget foreseen for each recipient region (as in international regions)
- The total budget foreseen for each recipient country
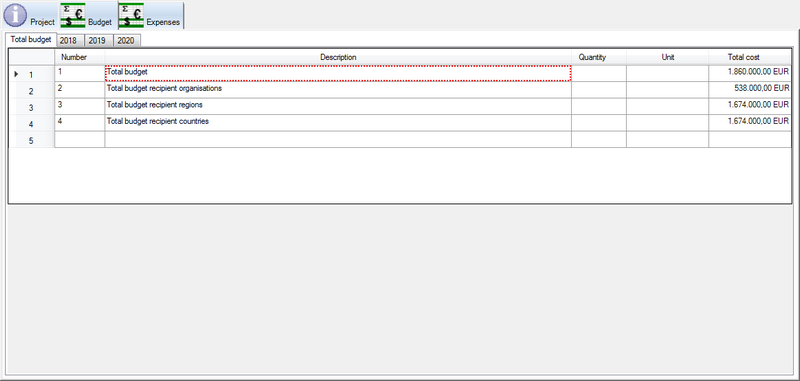
On the Total Budget page, you have to do nothing. Logframer will generate the necessary budget headings and calculate the numbers for you.
Next go to the first year and detail each budget header. How far you go is entirely up to you and depends on your transparency policy. You can provide lump sums or detail duration, quantities and unit costs.
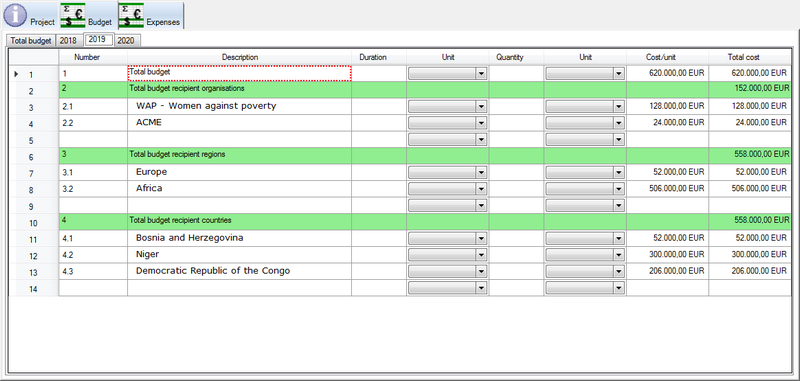
Contrary to the expenses, where you can make do with giving a global figure if you want to, you have to pay some extra attention to the detail you provide for
- The recipient organisations
- The recipient regions
- The recipient countries
IATI requires you to use the correct codes for each partner organisation, country or region that you add to the list. You do this using the Budget's Details pane. If this pane is not visible at the bottom of your screen, press <Ctrl><D> or click on the Show Details button in the Lay-out toolbar.
For a recipient organisation:
- Click on the name of the organisation in the Description column of the budget.
- In the Details pane, click on the Organisation tab
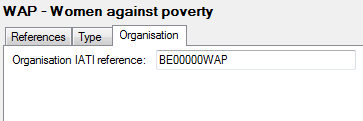
- Enter the partner organisation's IATI reference
For a recipient region:
- Click on the name of the region in the Description column of the budget.
- In the Details pane, click on the Region tab
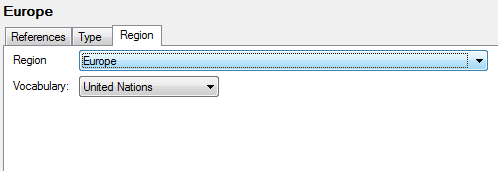
- Select the region using the first drop-down list. If you want to use another list of regions you can use the Vocabulary drop-down list. If you use your own coding system for regions, select 'Reporting organisation' from the second list and enter your own code in the Code field. However, in that case you have to make sure that your organisation's code list is also published on your website (add URL link). For more information, see the IATI website.
For a recipient country:
- Click on the name of the country in the Description column of the budget.
- In the Details pane, click on the Country tab
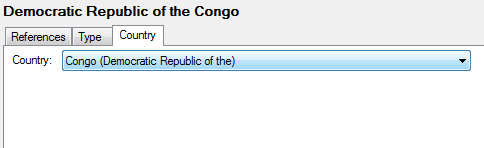
- Select the name of the country using the drop-down list
Once you've completed the first year you move to the next. If the costs are more or less the same you can start by copying the headings and values from the previous year. Select the budget headers that you want to update (drag with the mouse to select), go to the Items toolbar and click on the button that says Copy values from the previous year. This will save you some manual labour, all you have to do now is to update values where necessary.
Create the IATI organisation file
Creating the IATI organisation file (xml file) is very easy. Once you've completed all the information simply go to the File toolbar and in the Import & export section click on the IATI drop-down button.
Select the second option: Create an IATI file (xml)
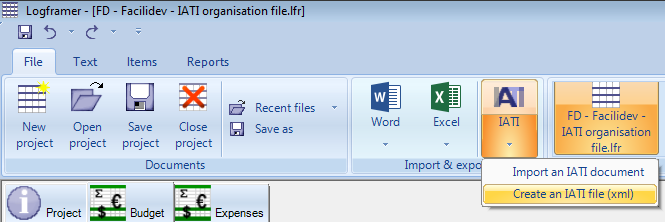
Give your document a name and click Save.
How to create an activity file
Creating an IATI activity file requires you to do three things:
- Create your project in Logframer
- Make sure you complete IATI specific information. First and foremost this means you need to enter a valid IATI identifier
- Create the IATI activity file.
IATI-specific information
To make sure you can see all the IATI-specific fields and lists in Logframer, select the IATI activity view mode in the File toolbar. Most IATI specific settings can be found in IATI tab of the Project information window.
Other IATI-specific information can be found in other locations:
- For each partner organisation, you need to include its IATI registry code (if it has one). Make sure your own organisation is listed as well in the partner list (once you've completed the information in the My organisation dialogue Logframer will add your organisation to each new project). Every organisation in the list is included as a partner organisation, unless you don't want to (see IATI settings). Contact persons are not included by default, so if you want to include someone as a contact person you should indicate this in their IATI settings.
- Make sure to include your intervention zone(s). Logframer will automatically create coordinates and country codes. For regional information or specific locations you need to specify a number of things on the IATI tab of the Intervention zone dialogue.
- Transactions are a key concept in aid transparency and you should pay special attention to them
Whatever you do, do not forget to include the IATI registry code of your project in the IATI tab of the Project information window.
Apart from these special attention points, the only thing you have to do is design your project and press the Create IATI file button. Logframer will turn all the information of your project in a IATI activity file. However, do note that IATI activity files contain less information than Logframer files, so not all the information of your project will be included. For instance, IATI activity files do not register verification sources, risks, assumptions or dependences (third and fourth column of your logframe). Likewise IATI doesn't support the number of sub-activities or sub-indicators that Logframer does, so you will only find the top-level indicators and activities in your activity file.
Speaking of indicators, IATI activity files can only handle indicators with values or percentages - see the next topic for more information.
Indicator targets and actual values
IATI activity files are limited in that can only handle indicators with values or percentages. Logframer transforms other types of indicators (yes/no indicators, multiple-choice, response scales, etc.) to value-based indicators, using the scores as values.
On the other hand IATI requires you to indicate both target values and actual values for each indicator. When you've selected the IATI activity view mode, you will therefore see that there are additional columns on the Targets tab where you can register the actual values:
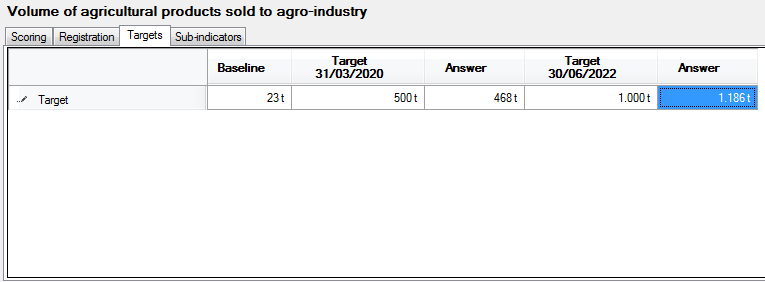
This option is only available for indicators of question type 'Value' or 'Percentage', because these are the only indicator types that IATI supports. For other types of indicators you can't register an actual value for now.
Create the IATI activity file
Once your project is complete you can create the IATI activity file (xml file). Go to the File toolbar and in the Import & export section click on the IATI drop-down button.
Select the second option: Create an IATI file (xml)
Give your document a name and click Save.
You can also create an IATI activity file that contains multiple projects. All you have to do is open the Logframer projects that you want to include in this file. Then you click on the Create an IATI file (xml) button again, but because more than one project is opened, you will get to see the following dialogue:
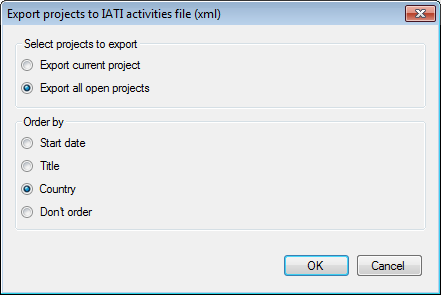
Choose the second option if you want indeed to create a file containing all the opened projects. Below you can choose in what order the activities will be included in the file: ordered by start date, title (alphabetically), country (idem) or simply in the order in which they have been opened.
Validating your IATI file
After you've created an IATI file (activity file or organisation file), you can check online whether it is in accordance with the IATI standard. To do so, visit the page of the IATI public validator.
First you have to upload your file. Click the Browse... button and select the file on your computer, then click Upload.
The Validator will do two tests. First it will check if your file is a well formed XML document. This is more of a technical test and it checks whether the document can be recognised as a XML document (and not a PDF document for instance).
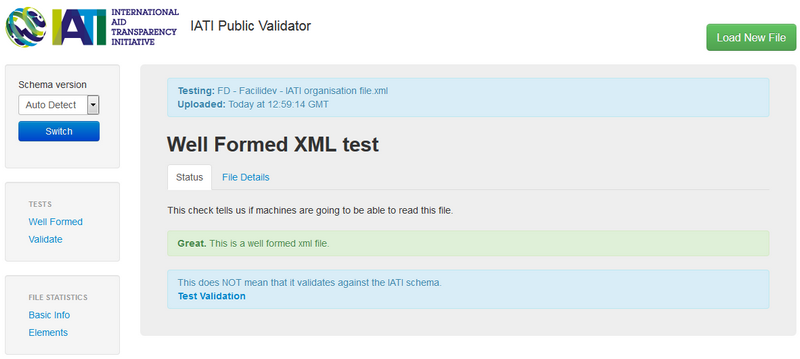
Secondly, you can start the actual validation by clicking on the Test Validation link (see above). If all goes well then you get to see the following screen:
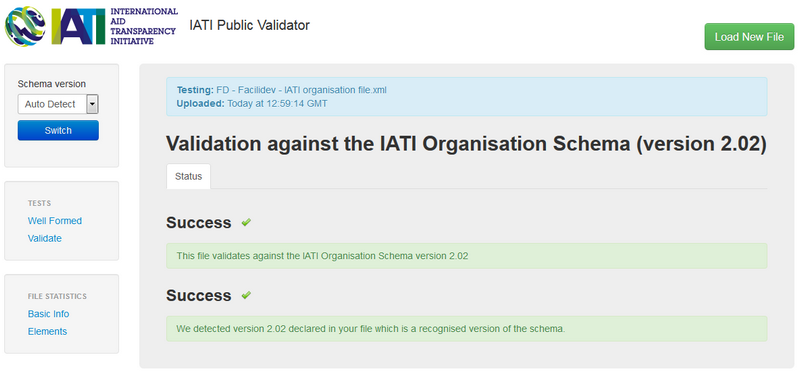
Reading and editing IATI files
In Logframer you can open IATI activity documents or organisation documents as well. To do so click the IATI button in the Import & export section of the File toolbar:
Logframer will create a new project for every activity in the IATI activity file (if there's more than one).
For some information Logframer will ask you to provide additional information. For instance, locations in IATI format do not mention the name of the country; so Logframer will ask you for clarification but will also make a suggestion based on other geographic information found in the IATI file.
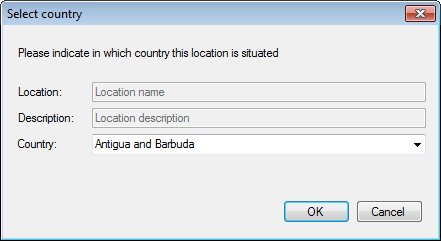
Creating reports and project management tools
Logframer not only helps you to reflect and develop a well-constructed project. It can also help you create tables and overview for your project documentation AND develop instruments to help you manage your project.
There is absolutely no obligation to fill out each and every field, column and list in Logframer. The idea is to offer you the tools you need to develop a project that suits you and the needs of your clients or beneficiaries. However, if you need certain tools or reports, you must complete certain information.
In this section of the manual we'll treat the following topics:
- Overview of the tools that Logframer can create
- Overview of the reports that Logframer can make
- Printing reports and options for report headers and footers
- Exporting reports to Microsoft Word™
- Exporting reports and tools to Microsoft Excel™
Tools
You can create the following project management tools in Logframer:
|
|
Excel |
Word |
Tool |
What can you do with it? |
What do you need to complete? |
|
|
X |
|
Follow-up of project over its entire duration: monitoring indicators and compare them to baseline and targets. The monitoring tool is the basis of your (upward & downward) accountability |
Identify indicators in the logframe Select monitoring deadlines (in Project info window) Identify target groups in the Project info window if you want to specify certain indicators for certain target groups Use Indicator Detail pane to specify question type, value ranges, scoring, baseline and targets |
|
|
X |
|
X |
Create questionnaires for interviewers to use, or to hand out to beneficiaries to complete |
Identify indicators in the logframe Use Indicator Detail pane to specify question type, value ranges, scoring, baseline and targets |
|
|
X |
X |
|
Follow-up the evolution of (potential) risks over the course of the project: likelihood, potential impact on the project and risk percentage |
Identify risks in the logframe Select risk monitoring deadlines (in Project info window) Use Assumption Detail pane to identify likelihood, impact and response strategy |
|
|
X |
|
X |
Register the details of (potential) beneficiaries, identifying them by name and location and registering any other information you find important |
Add target groups to the Target groups list on the Project information window |
Reports
You can generate the following reports:
|
|
Excel |
Word |
Report |
What can you do with it? |
What do you need to complete? |
|
X |
X |
X |
Design phase: develop logframe with (potential) beneficiaries during workshop; exchange & develop the logframe with partners Include logframe in funding applications towards donors Include logframe in Project documentation as reference during implementation Use and adapt logframe during implementation |
||
|
X |
|
X |
Design phase: exchange & develop the planning with partners Include planning in funding applications Include planning in Project documentation as reference during implementation Use and adapt planning during implementation |
Identify key moments in the Planning window or in the key moments list of each output (logframe) Identify processes and activities in the Planning window or in the logframe Use Activity Detail pane to specify start date, duration, preparation & follow-up periods, practical organisation and repetition |
|
|
X |
X |
|
Design phase: exchange & develop the budget with partners Include budget in funding applications Include budget in Project documentation as reference during implementation Use and adapt budget during implementation |
Choose between simple or multi-year budget Optionally use one of the budget templates List budget headers and budget items in the budget Specify unit cost, number of items and/or duration for each budget item |
|
|
X |
X |
X |
Design the basis of your monitoring framework by identifying which information you need to follow-up different objectives, what the baseline and targets will be, how you will find the information, how often you will monitor and who is responsible for monitoring that information |
Identify objectives, indicators and verification sources in the logframe Select monitoring deadlines (in Project info window) Use Indicator Detail pane to specify question type, baseline and targets Use Verification Source Detail pane to specify frequency and who is responsible for monitoring Alternatively, you can print an empty PMF and use that template to design the performance measurement system. Then you can use this information to complete in Logframer |
|
|
X |
|
|
Include Resources table in funding applications Project documentation: Provides an overview per output and activity which resources you will need and an (indicative) budget |
Identify objectives, activities and resources in the logical framework For each resource: specify an approx. total amount Or Design your budget in the Budget window For each resource: use the Resource Detail pane to add items from your (Total) budget and specify which percentage of the budget item will be used for this resource. |
|
|
|
|
X |
Risks table |
Include Risks table in funding applications Project documentation: Provides an overview of the risks you identified, how you will deal with that risk, which objective it may threaten or influence and the baseline assessment of the likelihood and impact of the risk |
Identify risks in the logframe Use Assumption Detail pane to specify likelihood, impact and response strategy |
|
X |
|
X |
Design phase: identify assumptions; determine how they can be validated and follow-up how you will validate them. Include Assumptions table in funding applications Project documentation |
Identify assumptions in the logframe Use Assumption Detail pane to specify likelihood, impact and response strategy |
|
|
X |
|
|
Design phase: identify dependencies and how they will influence your project Include Dependencies table in funding applications Project documentation |
Identify dependencies in the logframe Use Assumption Detail pane to identify the type of dependency, to specify deliverables and response strategy if the deliverables are not available |
|
|
X |
|
X |
Information on partners and contacts |
Design and implementation: keep an overview of the people and organisations involved in the project Use the Collaboration toolbar to contact them by e-mail, skype, telephone or mail Funding applications: provide an overview of your partner organisations |
Complete information about partner organisations and the people that work for them in the Project information window (tab Partners) |
Printing reports
To print a report, go to the Reports toolbar and select a report in the Reports section. Use the up/down buttons to scroll in the list of reports. Click on the drop-down button in the bottom right corner of the Reports section to get the complete list of available reports.
When you click on a report, you will get the print preview window:
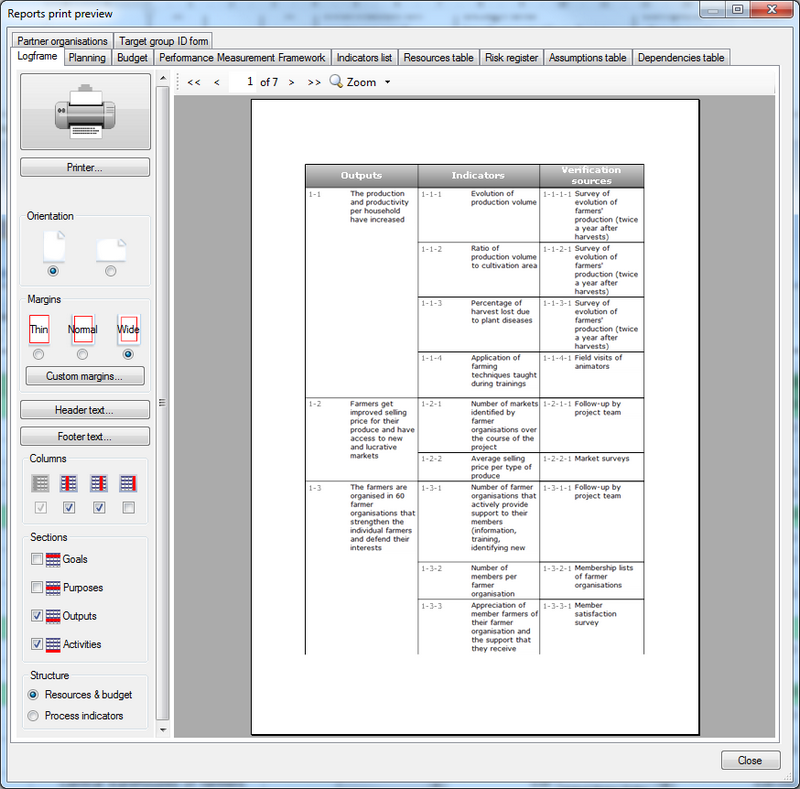
On the left side of the print preview window, you can see the print settings bar. On the right side you can see the print preview of the report in question. You can look at other reports by using the tab selectors at the top of the window.
Print settings:
- Click the big printer button to start printing on your default printer
- Use the Printer… button to select another printer or set specific settings for your printer
- Choose portrait or landscape orientation. Logframer will present some reports by default in landscape mode because they are relatively wide because of their nature
- Select thin, normal or wide printer margins. You can also set custom margins using the Custom margins… button
- Set the header text. You can optionally copy the header text to all report headers of your project.
- Set the footer text. You can optionally copy the footer text to all report footers of your project.
Report specific settings: these can be found below the general print settings. They allow you to print only certain types of items or information.
Width: enter how many pages wide the report can be. It is possible that the report needs more space than you wanted, so Logframer will increase the number of pages.
Headers and footers
For each report, you can set page headers and footers. To do so, press the Headers... or Footers... button in the Print Settings Bar.
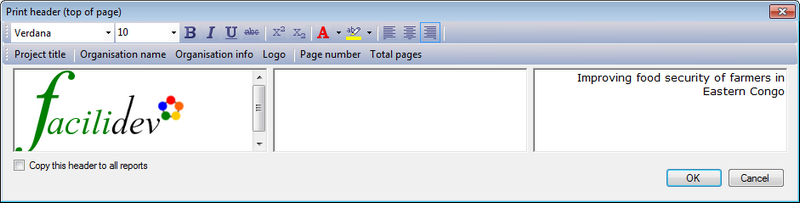
There are three text areas: on the left, the centre and on the right side of the page. You can use all text options (bold, italics, text colour...)
Insert project title
To insert the title of the project, click on the Project title button in the bottom toolbar
Insert organisation info and logo
If you've used the My organisation dialogue to provide details about your organisation (name, address, logo, etc.), you can use three buttons to insert this information directly in your header:
- Organisation name
- Organisation info: name of your organisation plus main address, main e-mail address and website
- Logo: inserts the logo of your organisation if you've loaded it in the My organisation dialogue
Insert page numbers and the total number of pages
To insert page numbers and/or the total number of pages, you can use the buttons on the right of the toolbar. Simply click with the text cursor on the place where you want to insert the page number, and then click on the Page number button.
A place-holder text will appear {&Page} that will be replaced by the actual page number in the preview or printed document. You can format this place-holder like you would any other text.
Copy the header/footer to all other reports
If you want the exact same header or footer on all your documents, you can check the Copy this header to all reports option (or Copy this footer to all reports option) on the bottom left of the dialogue. When you press the OK button, all other reports get the same outlook.
Exporting to MS Word
To export a report to Microsoft Word, go to the Reports toolbar and click on the drop-down button with the MS Word logo. A list of available reports to export will appear
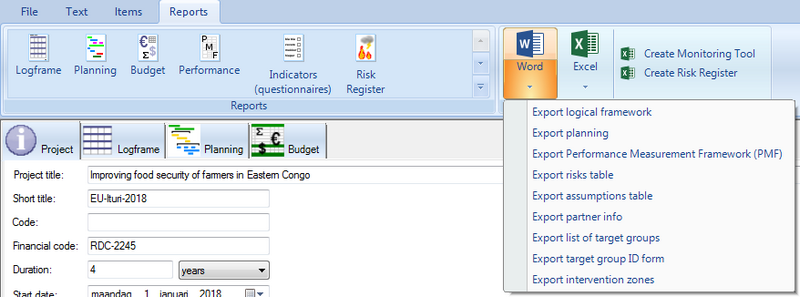
- Logical framework
- Planning
- Performance Measurement Framework
- Risks table
- Assumptions table
- Partner info
- List of target groups
- Target group identification form
- Intervention zones
When you select one of these reports, the Export to Word dialogue will open:
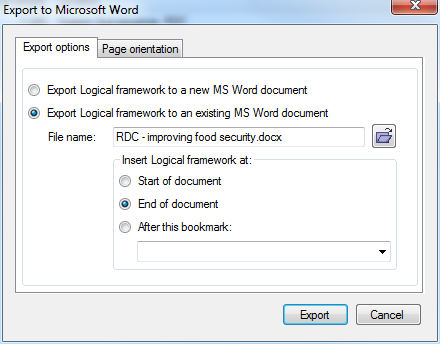
There are two main export options:
- Export the report to a new Microsoft Word document.
- Insert the report into an existing MS Word document, for instance a project proposal that describes the project in general. You can insert the report:
- At the very start of the document
- At the end of the document
- Right after a specific bookmark
If you click on the tab 'Page orientation', you can select the page orientation of the report:
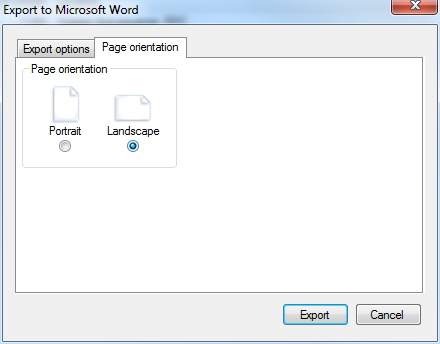
For some reports, other options will be available. In such a case an additional tab will appear.
Exporting to MS Excel
To export a report to Microsoft Excel, go to the Reports toolbar and click on the drop-down button with the MS Excel logo. A list of available reports to export will appear
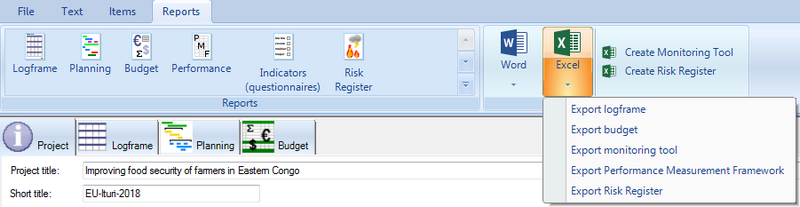
All these reports are exported to a new MS Excel document. This means you can’t insert a report into an existing document like you can when you export to MS Word. Depending on which report you choose you may get a dialogue with export options.
Importing logframes and budgets
When you install Logframer for the first time, you will probably already have a whole collection of existing projects and programmes. But if you want to use Logframer for an existing project, does it mean you have to re-enter all that information?
No, you don't have to re-do all that work. Logframer allows you to import existing logical frameworks and budgets. You can import:
- Logical frameworks in tables in Microsoft Word
- Logical frameworks and budgets made in Microsoft Excel
If you have logframes or budgets made in other applications, the easiest way to import them is to save the documents as MS Excel documents, or to copy and paste tables to a MS Excel document. The next step is then to import this workbook into Logframer.
Importing a logframe made in MS Word
Before you start importing a logical framework made in Microsoft Word, there are some preparations to be made:
- Make sure that there are absolutely no merged cells (rows, columns) in the logframe table. If there are any, split these cells. If any merged cells remain in the table, the import process will come to an abrupt stop and you will get an error message.
- Logframer re-numbers every item that is imported. If your MS Word logframe has any numbering, make sure the numbers are in a separate column. If the number of an item is in the same cell as the text, you'll have to remove it either in the Word version or after importing the table in the Logframer version.
To import a logframe from a MS Word document:
- In the File toolbar, go to the Import-Export section and click on the drop-down button with the MS Word logo. Select the first option from the drop-down list: Import an existing logical framework.
- You will see the Import dialogue, which has a four-step wizard to guide you through the whole process.
- Step 1: click on the Open file icon to select the MS Word document that contains your logframe. When you selected the document in the File dialogue, click on the Next step button
- Step 2: your Word document may contain more than one table. Select the right table from the drop-down list. On the bottom of the window you will see the contents of the table you selected. When you've found the right table, click on the Next step button.
- Step 3: Use the drop-down lists to select the columns that contain: the objectives, the indicators, the verification sources and the assumptions. If your logframe has both number columns and text columns, only select the text columns. Logframer will do the numbering for you. When you're finished, press the Next step button.
- Step 4: For each section of the logframe (goals, purposes, outputs and activities) enter the number of the row where the section starts and ends. It's best to skip any rows that contain titles because if you include these, Logframer will import them as actual goals, indicators, assumptions, etc. For the activities section, you also have to select whether the columns next to the activities contain resources and estimated costs, or process indicators with their verification sources.
- Press the Import button to start the process
Step 1: select the Word document that contains the logframe
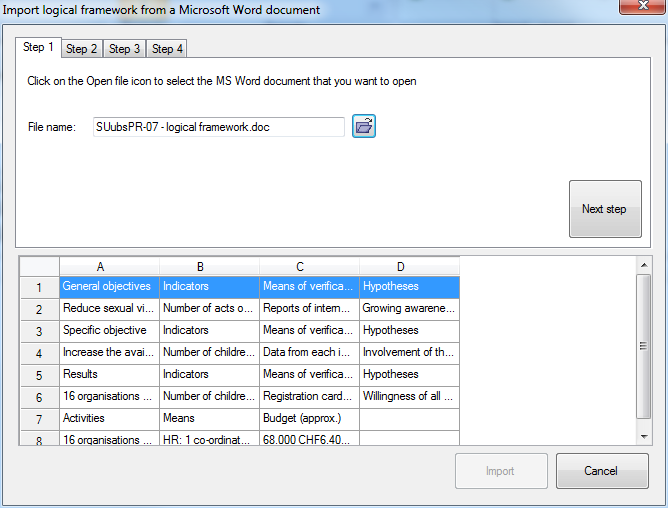
Step 2: select the table that contains the logframe
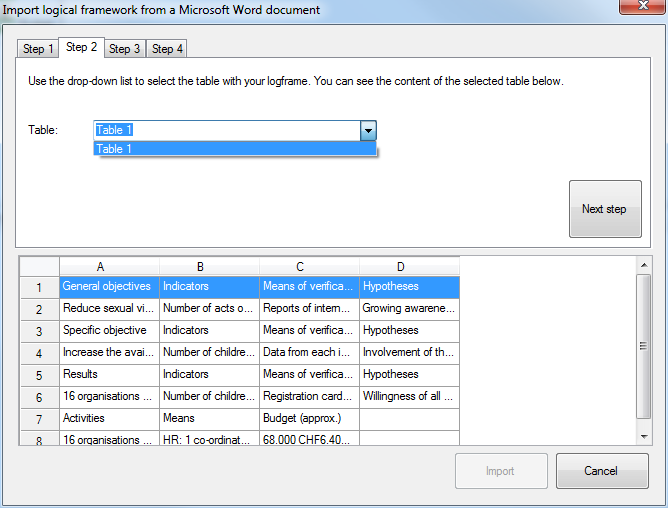
Step 3: indicate which columns contain objectives, indicators, verification sources and assumptions
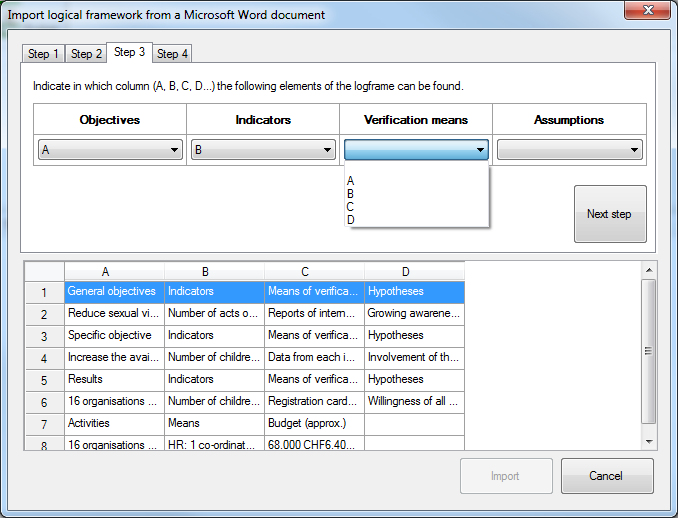
Step 4: indicate the rows that contain the goals, purposes, outputs and activities
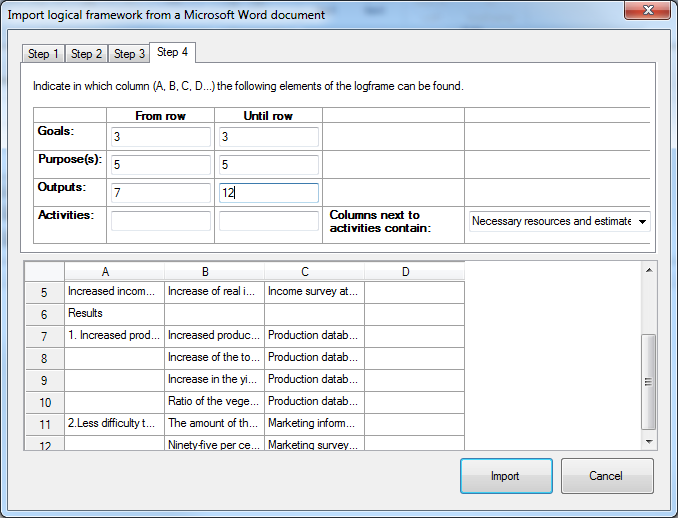
Note that you are not obliged to import all sections. If you leave the start row and final row of a section empty, Logframer will skip that section during the import.
When the process is finished, you will probably need to do some re-ordering. By default, Logframer places all the outputs under the first purpose and all the activities under the first output. Also, no distinction is made between main activities and sub-activities.
Please refer to the articles about moving logframe items and managing different levels of activities and indicators to finalise your logical framework.
Importing a logframe made in MS Excel
Before you start importing a logical framework made in Microsoft Excel, there are some preparations to be made:
- Make sure that there are absolutely no merged cells (rows, columns) in the logframe table. If there are any, split these cells. If any merged cells remain in the table, the import process will come to an abrupt stop and you will get an error message.
- Logframer re-numbers every item that is imported. If your MS Excel logframe has any numbering, make sure the numbers are in a separate column. If the number of an item is in the same cell as the text, you'll have to remove it either in the Excel version or after importing the table in the Logframer version.
To import a logframe from a MS Excel document:
- In the File toolbar, go to the Import-Export section and click on the drop-down button with the MS Excel logo. Select the first option from the drop-down list: Import an existing logical framework.
- You will see the Import dialogue, which has a four-step wizard to guide you through the whole process:
- Step 1: click on the Open file icon to select the MS Excel document that contains your logframe. When you selected the document in the File dialogue, click the Next step button
- Step 2: your Excel workbook will probably contain more than one worksheet. Select the right worksheet from the drop-down list. On the bottom of the window you will see the contents of the worksheet you selected. When you've found the right one, click on the Next step button.
- Step 3: Use the drop-down lists to select the columns that contain: the objectives, the indicators, the verification sources and the assumptions. If your logframe has both number columns and text columns, only select the text columns. Logframer will do the numbering for you. When you're finished, press the Next step button.
- Step 4: For each section of the logframe (goals, purposes, outputs and activities) enter the number of the row where the section starts and ends. It's best to skip any rows that contain titles because if you include these, Logframer will import them as actual goals, indicators, assumptions, etc. For the activities section, you also have to select whether the columns next to the activities contain resources and estimated costs, or process indicators with their verification sources.
- Press the Import button to start the process
Step 1: select the Excel workbook that contains the logframe
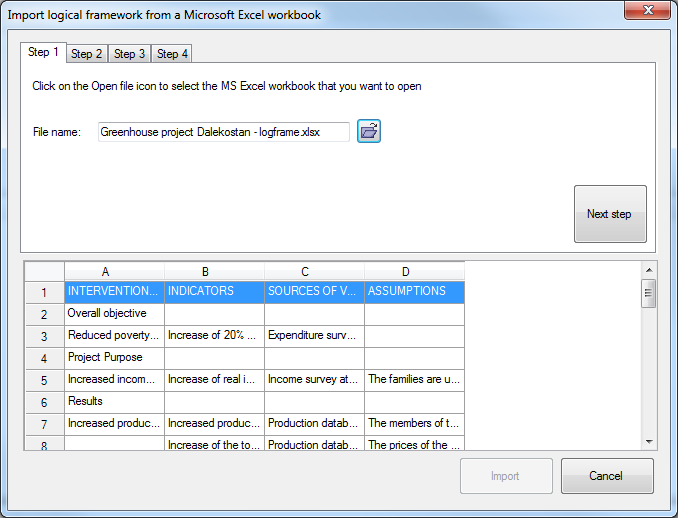
Step 2: select the worksheet that contains the logframe
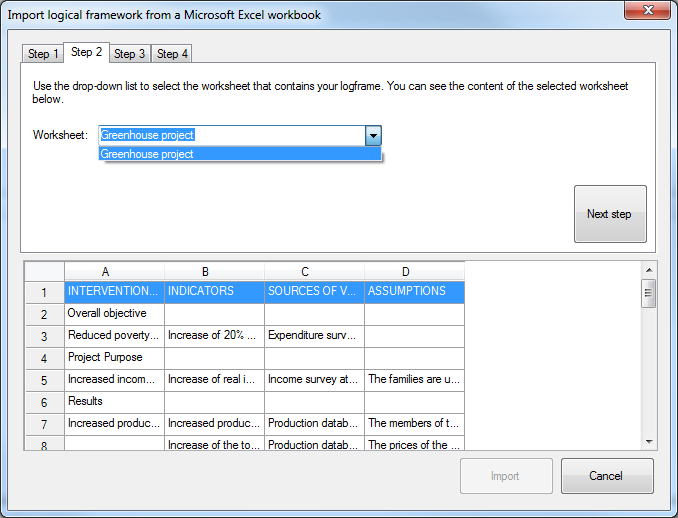
Step 3: indicate which columns contain objectives, indicators, verification sources and assumptions
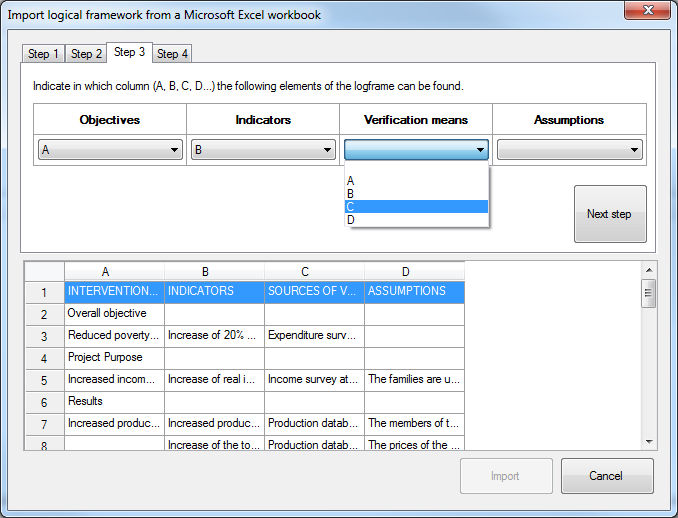
Step 4: indicate the rows that contain the goals, purposes, outputs and activities
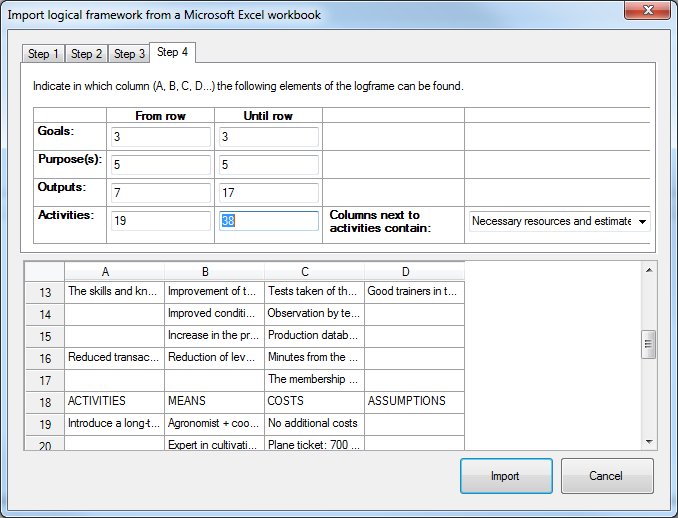
Note that you are not obliged to import all sections. If you leave the start row and final row of a section empty, Logframer will skip that section during the import.
When the process is finished, you will probably need to do some re-ordering. By default, Logframer places all the outputs under the first purpose and all the activities under the first output. Also, no distinction is made between main activities and sub-activities.
Please refer to the articles about moving logframe items and managing different levels of activities and indicators to finalise your logical framework.
Importing a budget made in MS Excel
Logframer can import budgets from a single worksheet. This means that you can't import a whole multi-year budget. You can however import the Totals page of your budget and then (after clearing up) click on the Multi-year budget button in the Budget Lay-out toolbar. Then you can add the items of each budget year manually below the common headers.
Before you start importing a budget made in Microsoft Excel, there are some preparations to be made:
- Make sure that there are absolutely no merged cells (rows, columns) in the budget table. If there are any, split these cells. If any merged cells remain in the table, the import process will come to an abrupt stop and you will get an error message.
- Logframer re-numbers every item that is imported. If your MS Excel budget has any numbering, make sure the numbers are in a separate column. If the number of an item is in the same cell as the text, you'll have to remove it either in the Excel version or after importing the table in the Logframer version.
To import a budget from a MS Excel document:
- In the File toolbar, go to the Import-Export section and click on the drop-down button with the MS Excel logo. Select the second option from the drop-down list: Import an existing budget.
- You will see the Import dialogue, which has a four-step wizard to guide you through the whole process.
- Step 1: click on the Open file icon to select the MS Excel document that contains your budget. When you selected the document in the File dialogue, click the Next step button
- Step 2: your Excel workbook will probably contain more than one worksheet. Select the right worksheet from the drop-down list. On the bottom of the window you will see the contents of the worksheet you selected. When you've found the right one, click on the Next step button.
- Step 3: Use the drop-down lists to select the columns that contain:
- The description of the items (text)
- The duration (optional): if you have a column with the number of months that staff will work for the project for instance
- Number (optional): if you have a column that indicates how many of each item you need.
- Unit cost column (mandatory)
- Total cost column
- Step 4: Enter the number of the row where the budget starts and ends. If the first row is a title row it's best to skip it otherwise Logframer will import it as a budget item.
- Press the Import button to start the process
Step 1: select the Excel workbook that contains the budget
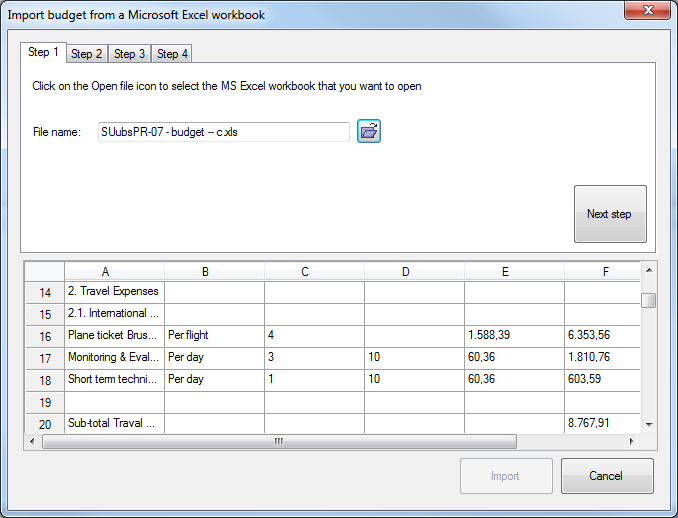
Step 2: select the worksheet that contains the budget
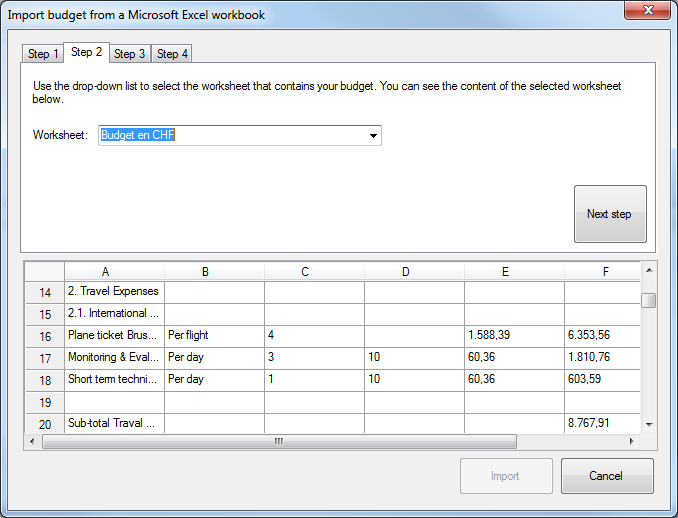
Step 3: indicate which columns contain the description, duration, number, unit cost and total cost of each item
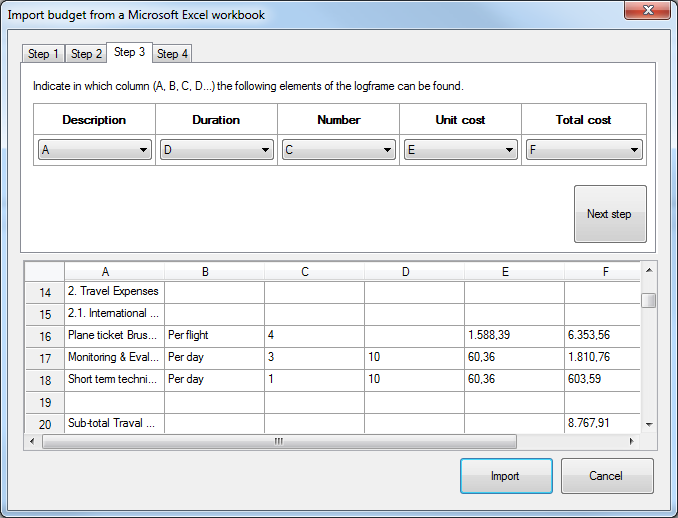
You are not obliged to fill out any column except the description and total cost columns.
Step 4: indicate the rows that actually contain the budget
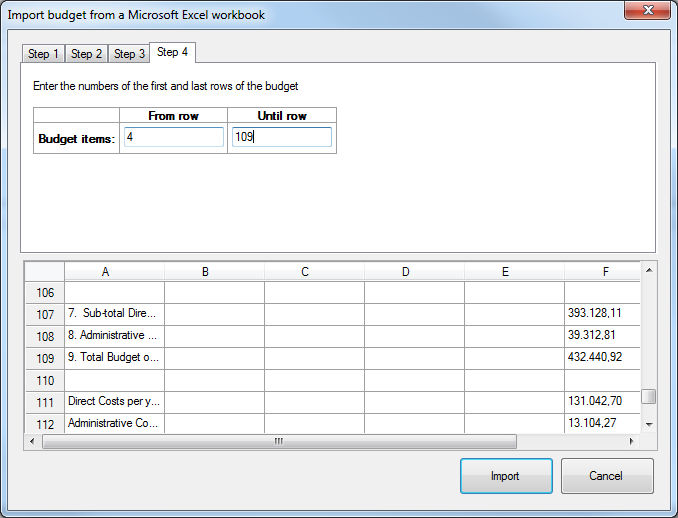
When the process is finished, you will probably need to clean up the budget, because no distinction is made between budget items and budget headers. So you need to level down the items that belong to a certain budget header.
Please refer to the articles about moving and managing different levels of budget items to finalise your budget.
Collaboration tools
You can find the collaboration tools in the Collaboration toolbar. This will appear when you go to the Project information window and select an item in the list of partner organisations or in the list of contacts of a certain partner organisation.
There are four buttons:
- Send an e-mail
- Send a letter: open a new MS Word document and create a header with the address information of the person or organisation in question
- View the website of the organisation/person
- Start a Skype call with a person
To use these buttons, just click on the name of an organisation or person in the Partners list and then on a button.
If there is more than one e-mail address, mail address or website, Logframer will select the ‘Main’ address or site. If no e-mail address, mail address or website, has its type set to ‘Main’, the first item in the list will be selected.
If you want to select a different address or site, double click on the organisation or person to open a dialogue window with detailed information. Select the address or site of your choice and click on the button in the toolbar in the dialogue window (not the Collaboration toolbar of the main window).
Settings
The design of the logframe
Click on the Settings button in the File toolbar to open the Logframer settings dialogue.
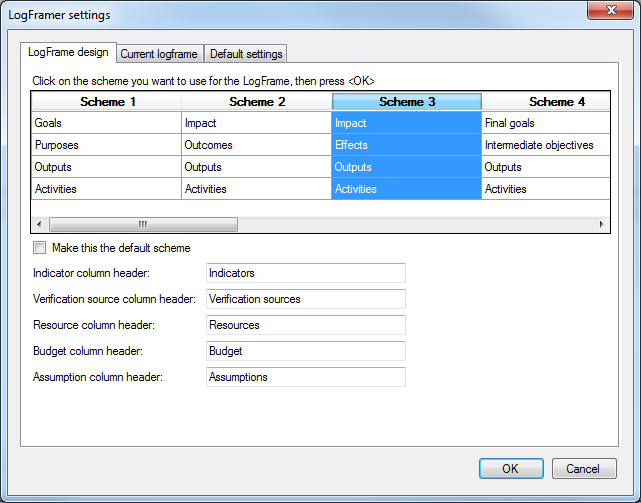
On the first tab you can change the titles of your logical framework. There are many flavours of the logical framework and you can select from 11 different schemes.
Below you can change the titles of the indicators, verification sources, resources, budget and assumptions column.
If you want a certain scheme to become the default scheme for all your new logframes, check the Make this the default scheme button.
Current logframe settings
Click on the Settings button in the File toolbar to open the Logframer settings dialogue.
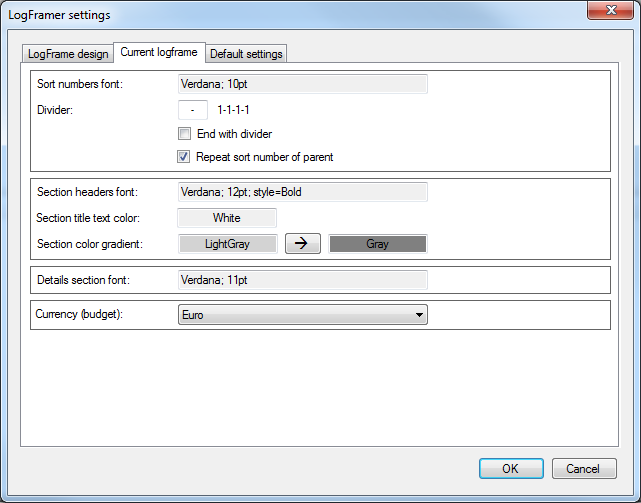
On the second tab you can change the colours and fonts of the numbers, the section headers and the Details pane. You can also select a default currency here for your budget (you can also change this setting using the Exchange rates pane)
Default settings
Click on the Settings button in the File toolbar to open the Logframer settings dialogue.
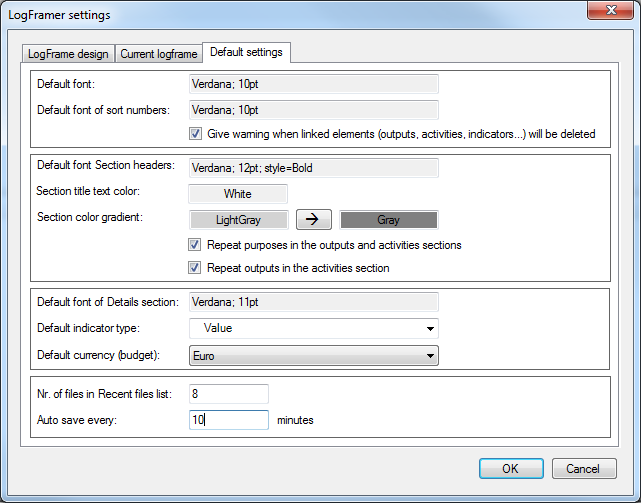
On the third tab you can change default font of the text and the colours and fonts of the numbers, the section headers and the details pane.
When you add indicators, they will be value indicators by default, but you can change the default indicator type here as well.
Finally select a default currency here for any new budgets you make.
The section on the bottom allows you to specify how many files you want in the Recent files list, and if and when you want Logframer to auto-save your document. If you don't want to use auto-save, change this setting to zero.
Changing the language of the interface
In the File toolbar, use the Language drop-down button to select one of the available languages for the Logframer interface:
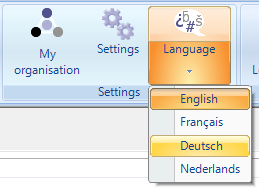
- English
- French (français)
- German (Deutsch)
- Dutch (Nederlands)
When you've made your selection, Logframer will restart in the language of your choice.