Tools: Monitoring tool
The Monitoring tool is a very powerful and interactive tool. It allows you to monitor your project for its entire duration, using the different types of indicators you've selected. Basically, you'll get a complete monitoring and evaluation system at one click of a button.
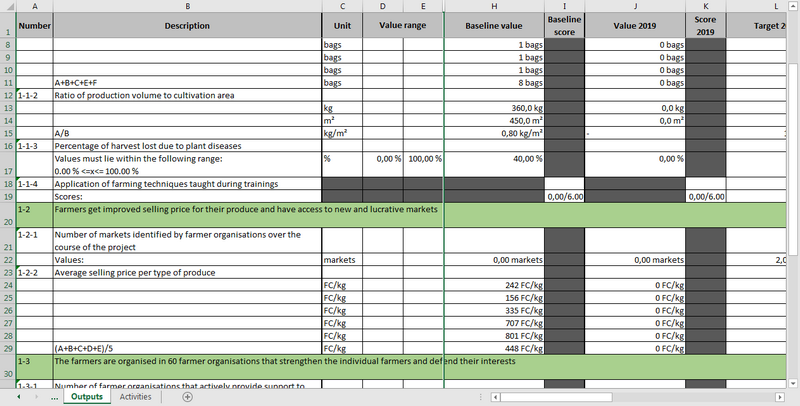
The Monitoring tool is a report that you can export to MS Excel. In the Import/export section of the File toolbar, click on the Create Monitoring Tool button.
You can select if you want to view all indicators or the indicators of a specific level (goals; purposes; outputs; activities). You can also select a specific target group, or the indicators for all target groups.
Note that it may take some time to export this report, especially if you have many indicators. When Logframer opens Excel, don't do anything in Excel (clicking in a cell etc.) because this will terminate the exporting process.
One final remark is that the different scales (Thurstone, Likert, Guttman) are only partially included, in the sense that you can only register the total scores. The actual tables with the statements and response scales are not included. The idea here is that you print the list of indicators, fill the forms out in the field and then you enter the results in this table.

Recent blog posts
- Website occasionaly down
- Logframer training videos by Atiq Rehman
- Logframer Training at University of Blida (Algeria)
- Update of Logframer 3.1
- Logframer 3.1 is out (y disponible en español)
- Installation problem
- IATI part II – Does IATI provides us with a better understanding of aid flows?
- IATI part I – What is the International Aid Transparency Initiative?
- Logframer by the Numbers - 31000 Downloads and Counting
- Logframer 3.0 preview
Recent comments
- Multi Projects management 4 years 4 months ago
- Font Display Size 4 years 5 months ago
- Adjusting Font Display Size 4 years 5 months ago
- Merci pour cet outil de 4 years 5 months ago
- Thank you! 4 years 5 months ago
- Output, outcome and impact analysis 4 years 8 months ago
- PCM Model of Six Phases 4 years 9 months ago
- Appreciation 4 years 10 months ago
- Adjusting Font Display Size 5 years 1 month ago
- downloading 5 years 2 months ago
User login


Add new comment