Working with the logframe
To design the logical framework of your project, select the Logframe tab.
The Logical Framework window allows you to design the logframe of course, but using the Details pane you can also add additional information. This in turn will allow you to design specific tools:
|
Main window |
Details pane |
Tools |
|
Goals |
Project information (1) |
|
|
|
List of partners (1) |
List of partner organisations for project documentation |
|
Purposes |
Target groups (1) |
|
|
Outputs |
Key Moments (2) |
|
|
Processes, activities & sub-activities |
Preparation and follow-up periods (2) |
|
|
|
Repeating activities (2) |
|
|
Indicators and sub-indicators |
17 different types of indicators |
Monitoring tool in Excel |
|
|
Targets and scores |
|
|
|
Statements and responses |
Questionnaires / indicator lists |
|
|
Value ranges |
|
|
Verification sources |
|
Included in Performance Measurement Framework |
|
Risks, assumptions and dependencies |
Detailed information according to RAID typology |
|
|
|
|
|
|
Resources |
References to specific budget items and % used for that particular resource |
(1) You can also do this in the Project Information window
(2) You can also do this in the Planning window. In the Details pane of the logframe you can modify dates, durations and so on, but in the Planning window you have drag-and-drop functionality
Logframe items
The logical framework allows you to design the structure of your project, containing the following logframe items:
- Project logic items are arranged in the first column, in four sections:
- Goals (top section) or long term objectives: these are the broad objectives on the level of the (local) society that your project contributes to. This means you don't expect them to be achieved entirely by your project, but it will help advance the local society towards these objectives. As such, this means you don't have these objectives fully under your control.
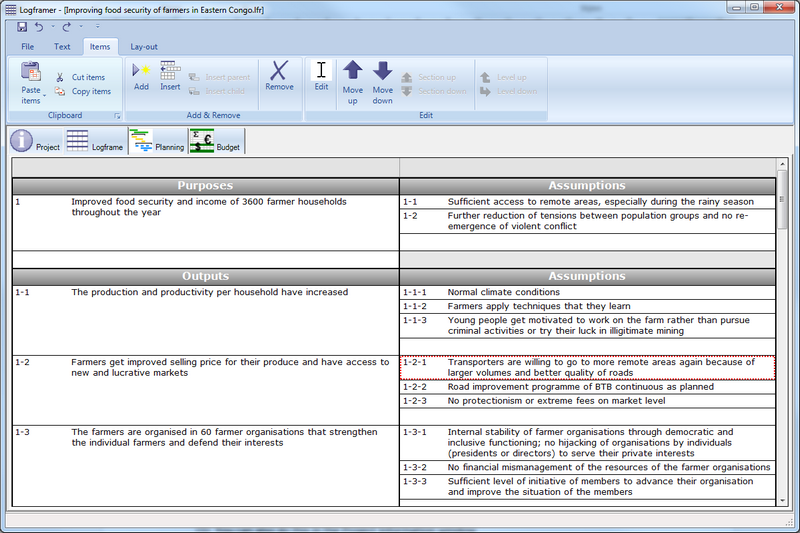
- Purposes: a purpose explains why your project exists in the first place. It is the main objective of your project, which you hope to achieve by its completion (medium-term objective). It is often recommended to have no more than a single purpose in your project, but Logframer can handle more than one purpose. If you do have more than one purpose, your outputs and activities will be grouped per purpose.
- Outputs: these are the direct and tangible results of the activities and processes of the project. For each purpose, you can have as many outputs as you want.
- Activities: to achieve each output, you can include one or more activities designed to create this output. You can even split up larger processes (activities) into sub-activities (or smaller processes split up into sub-sub-activities and so on).
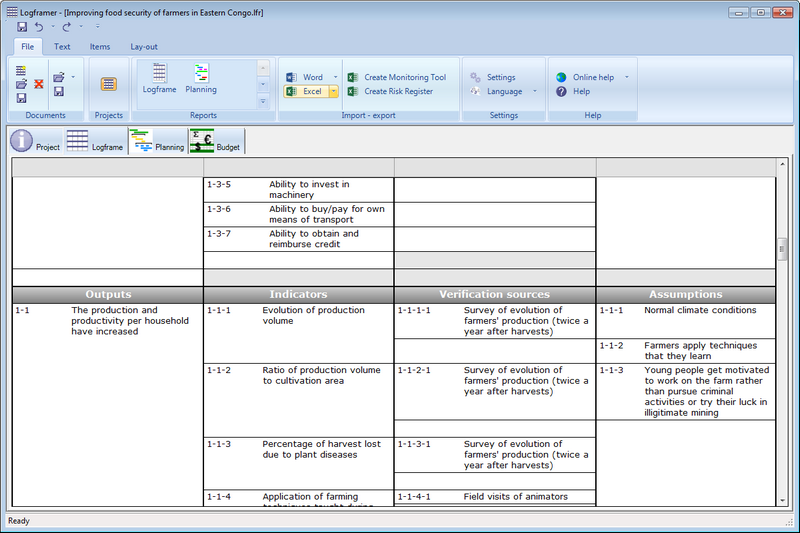
- Indicators are listed in the second column. For each objective (goal, purpose, output) or activity you can identify as many indicators as you want. Indicators can also have sub-indicators (and sub-sub-indicators etc.) You can design indicators to follow up each type of objective:
- Impact indicators to follow the evolution of the goals
- Effect indicators to follow up the progress towards the purpose(s)
- Output indicators to follow up the delivery of outputs
- Process indicators to follow up the progress of activities and processes
- Verification sources are listed in the third column. For each indicator you can include one or more verification sources
- Risks, assumptions and dependencies are listed in the fourth column. For each objective you can list as many risks, assumptions and dependencies as you want
- Resources are only available in the Activities section at the bottom. Here you can switch the view from listing indicators and verification sources for each activity, or the resources and budget. For every (sub-)activity you can list as many resources as you want. In the Budget column of the logframe (bottom of the Verification Sources column) you can specify an indicative total for the resources. Alternatively, you can calculate this amount by selecting items from the budget.
Parent-child relations
Logframe items are linked to each other in two ways:
- Purposes, outputs and activities are vertically linked to each other (vertical logic): each purpose can have several outputs, each output can have several activities and each activity (process) can have several sub-activities (and so on). Each indicator can also have several sub-indicators (and sub-sub-indicators and sub-sub-sub-indicators and so on).
- Objectives or activities can have several indicators and several risks/assumptions/dependencies. Each indicator can have several verification sources. This is the horizontal logic.
When you move items around, Logframer will make sure the vertical and horizontal logic remains intact. This means for instance that when you drag output 2 before output 1, that in the bottom section the activities of output 2 will also be placed before the activities of output 1.
When you move an indicator that has several verification sources and you only select the indicator itself, the verification sources will remain in place and you will see a place-holder text.
Adding items and working with text
To add an item, simply click in an empty box and start to type. At the bottom of each section in each column you will always find an empty text box. If these empty boxes are not visible, select the Lay-out toolbar and click on the Show empty cells button in the View section.
You can edit the text like you would in any word processor using the Text toolbar. You can change the typeface or size, make text bold, underlined, etc. and align the text to the left, right or centre.
If you want to change the appearance of all text in the logframe, or all the text in the Indicators column for instance, use the text selection options to select multiple cells and then modify the text to your liking.
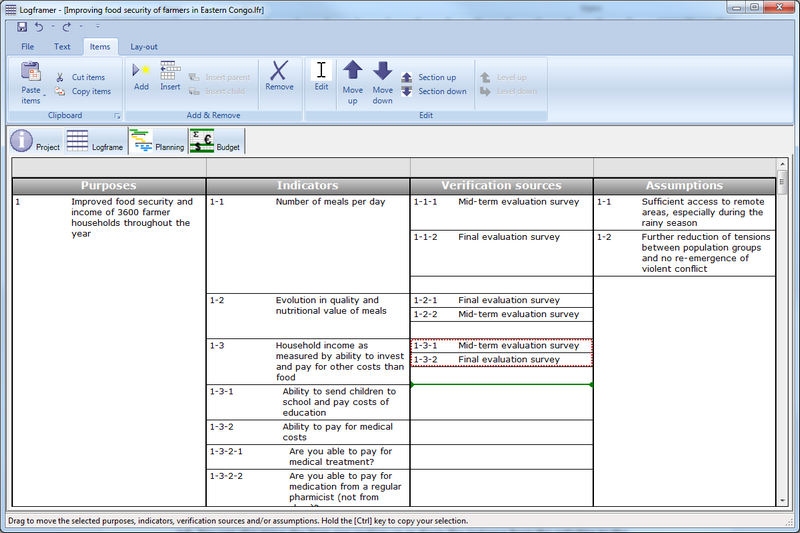
Moving items around
You can move a single item or a group of items from one section to the other or from one column to the other, or simply change the order that the items are displayed.
To select a single item, click on it with the left mouse button. To select more than one item, press the left mouse button and drag. The red selection rectangle will expand to include other cells, but you can only select cells within a single section.
To move items, press the right mouse button within your selection (red selection rectangle) and drag it to the place where you want to insert the items. A green indicator line will appear and show the current location. When you come close to the top or bottom border of the logframe, it will scroll up or down. Release the right mouse button to insert the items you selected.
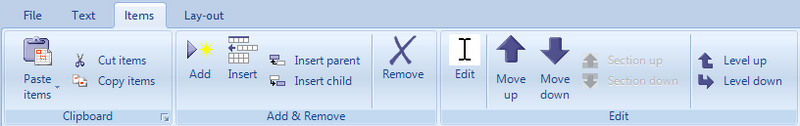
Another way to move items is to use the Move Up and Move Down buttons in the Items toolbar. You can also move the item one section up or down (for instance from the activities to the outputs section).
Copying and pasting items
You can cut, copy and paste items in three different ways. First select the items you want to cut or copy (see ‘Moving items around’).
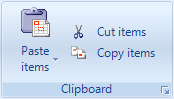
- Use the Cut, Copy and Paste buttons of the Items ribbon tab.
- Press Ctrl+X to cut; Ctrl+C to copy and Ctrl+V to paste
- Right click into the red selection rectangle and move the green indicator line to where you want to copy the item(s) (see ‘Moving items around’). But this time hold the Ctrl button when you release the right mouse button. This will copy the selected item(s) instead of cutting and pasting them.
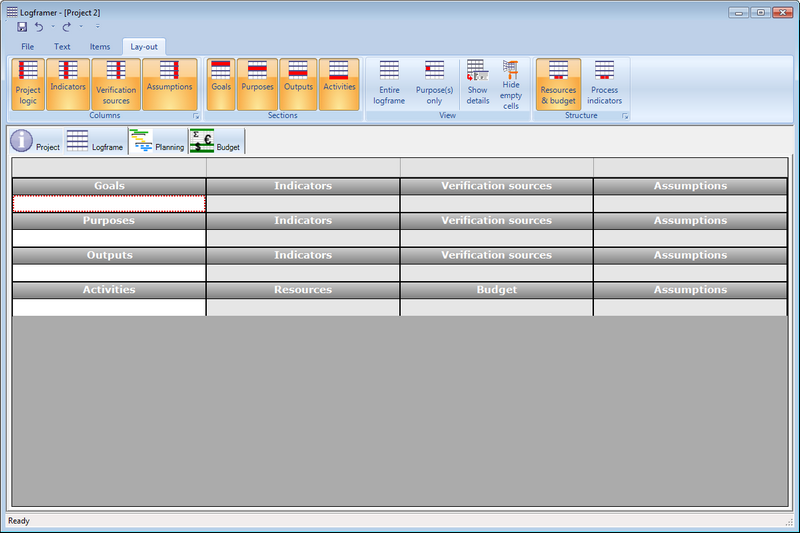
Changing the lay-out of the logframe
Using the Lay-out toolbar, you can hide columns and sections; hide everything but your project's main purpose(s); switch between viewing the process indicators or the resources; and show or hide the Details pane.
This enables you to make custom versions of the logframe, which you can then print or export to MS Word or MS Excel. It also allows you to hide the columns or sections that you are not working, making it easier to focus.
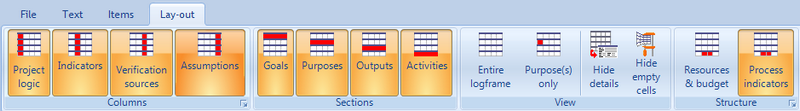
The Lay-out toolbar has the following ribbon panels and buttons:
- Columns ribbon panel: hide or show the Indicators, Verification Sources and/or Assumptions column. The Project Logic column will always remain visible, but if you click this button the three other columns will hide or show.
- Sections ribbon panel: hide or show the Goals section, the Purposes section, the Outputs section and/or the Activities section
- View ribbon panel:
- Show the entire logframe
- Show the project's main purpose(s) only
- Hide or show the Details pane at the bottom of the screen
- Hide empty cells: click this button to hide the empty cells at the bottom of each group of items. This will make the view of the logframe more compact. You can still insert or add items using the Items ribbon.
- Structure ribbon panel: in the Activities section (bottom section of the logframe), you can choose between viewing process indicators and their verification sources (columns 2 and 3), or the resources and (estimated) cost necessary for each activity.
Tools: the logical framework
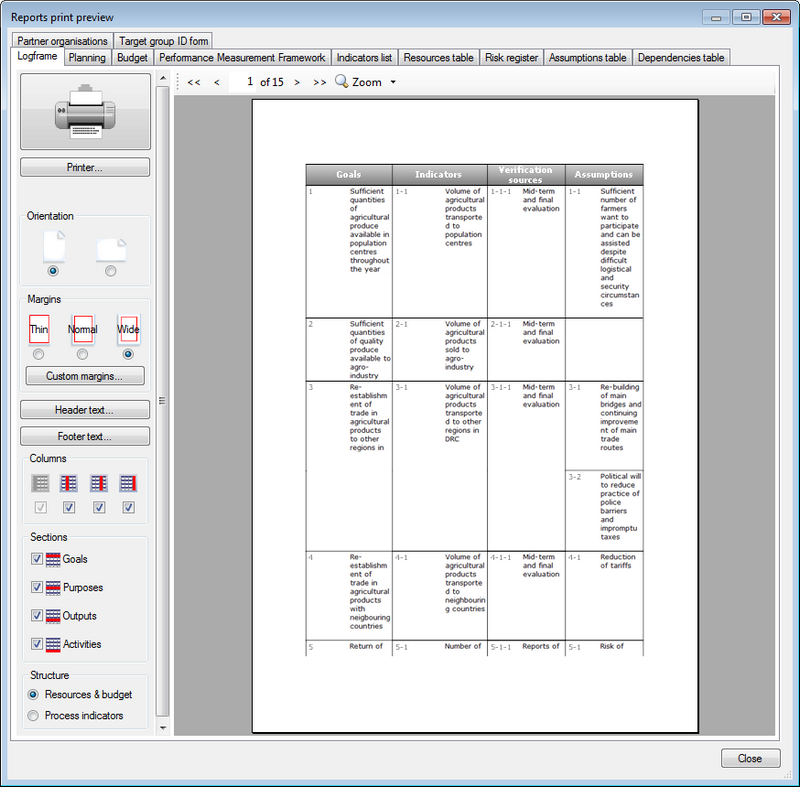
You can print the logical framework, export it to MS Word or to MS Excel. When you print or export the logframe, you can customise its appearance:
- You can show or hide columns
- You can show or hide sections (goals, purposes, outputs, activities)
- In the activities section, you can choose between showing the performance indicators and their verification sources, or the resources and budget necessary for each activity.
This way you can easily produce different versions of the logframe for your funding applications, for training purposes, for communication purposes, for project management, etc.