Question types
Value-based indicators are probably the most popular type of indicators used for monitoring projects. However, they may not always be the best choice. Logframer offers you no less than 17 different types of indicators to make sure you have the right indicator for the right occasion. They are grouped in five main groups:
- Indicators without targets: sometimes it is impossible to predict what changes will be brought about by your project, but you still want to know what the effects are.
- Value-based indicators: the most used and arguably the easiest way to keep track of your project
- Multiple option indicators: if you have indicators with multiple dimensions, multiple option or multiple choice indicators can be the right choice.
- Ordinal indicators: similar to multiple choice or multiple option, but in this case there is a particular order in the possible answers, from low to high or from small to big or…
- Indicators to express opinion: to measure more complex things like opinions and behaviour you may need answer scales such as the Likert scale that make use of different statements. The development of such indicators takes more effort but in certain circumstances they can be very valuable.
Before you start detailing your indicators, the first choice you have to make is on the right type of question to use. On the Scoring tab, select one of the options from the Question type drop-down list:
|
Indicators without targets |
Ask a question and specify how much space the respondent (or interviewer) gets to answer |
|
|
|
The respondent gets a number of different options and can indicate which is the best and the worst option |
|
|
|
Include a picture of the situation before the project. For each report the respondent has to include a follow-up picture |
|
|
Value-based indicators |
Specify baseline and target values; choose the unit (items, kg, liters…) and specify a value range if necessary (min. and maximum values) |
|
|
|
Same as the above, but expressed as a percentage |
|
|
|
The respondent has to provide two numbers and then the ratio is calculated (for instance ratio of girls to boys in schools) |
|
|
|
Allows the respondent to give a series of numbers. You can specify a formula to give you the total number you want. Useful for sums of a series of items, complex ratios etc. |
|
|
Multiple options |
Respondent/interviewer can tick the box next to yes or no |
|
|
|
Identify different options so the respondent/interviewer can tick one or more of the options |
|
|
|
Identify different options so the respondent/interviewer can tick (only) one of the options |
|
|
Ordinal questions |
Identify different options, which the respondent has to rank according to his/her preference |
|
|
|
A typical Likert scale has five options (but can also be less or more), for example: strongly disagree; agree; neutral; disagree; strongly disagree. This indicator has only one statement to score |
|
|
|
Similar to a Likert type scale, but with a series of pairs: interesting – not interesting; practical – not practical; smurf – not smurf |
|
|
Expressing opinion |
Uses a series of statements on which the respondent can indicate if he/she agrees or disagrees with the statement. Each statement expresses a more or less positive attitude towards the concept that’s being analysed. These statements have been issued a score before based on a preliminar survey. This score is then used to measure the attitude of the respondent. |
|
|
|
Similar to Thurstone scale in design, but instead of a choice between agree/disagree, the respondent can give a more nuanced answer by indicating how strongly he/she agrees or disagrees. |
|
|
|
Similar to Thurstone scale, but the statements are ranked, meaning that if you agree with the fourth statement, it is understood that automatically you agree with the three that came before. |
|
|
|
A likert scale that is useful for working with groups, organisations, etc. because instead of indicating what the answer is of one person, you can register how many people have chosen that particular option (frequency). |
|
|
Other types |
Not only can you show an image of the baseline situation, but you can also include images of how the situation will look like from one moment to the other. |
|
|
|
Mixed sub-indicators |
If you add sub-indicators of different question types to a main indicator, the question type of the latter will be set to ‘Mixed sub-indicators’. The total score of this main indicator is always a score (never a value or percentage). |
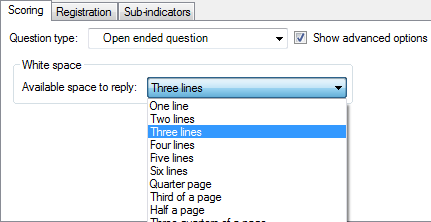
Open ended question
Set the amount of white space that you want to give to the respondent/interviewer on the questionnaire.
Best/worst scaling (Max Diff)
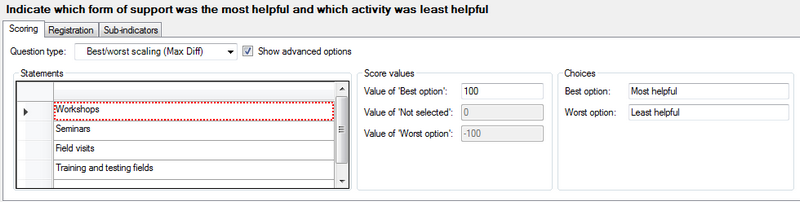
On the Scoring tab:
- Enter the options that the respondent can choose from in the Statements list
- Give a scoring value for the ‘Best option’, for instance 100. The ‘Not selected’ option will always be 0 and the 'Worst option' is the inverse of the Best option (-100).
- You can change the text for Best and Worst option in the Choices box.
Images
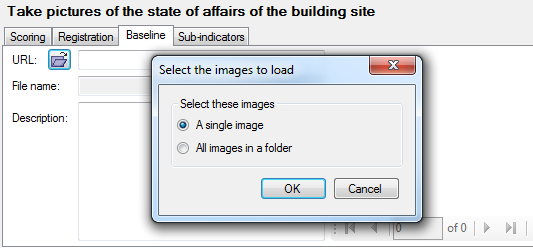
On the Baseline tab:
- Click on Open document icon next to URL to select the picture that you want to open
- You can add a description of the picture
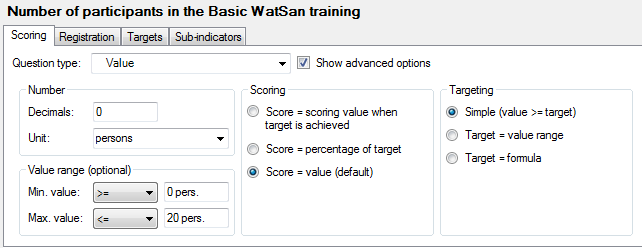
Values
On the Scoring tab:
- Number box: indicate the precision (number of decimals) and select a unit from the list, or enter a new unit. If you enter a custom unit it will become available for all indicators in the current project (but not in other projects).
- Value range box: You can limit the value range that the respondents can give by specifying a minimum value and/or a maximum value. This means that you can’t enter target values that lie outside this value range.
- Scoring and Targeting: see the page on this topic
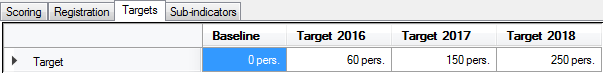
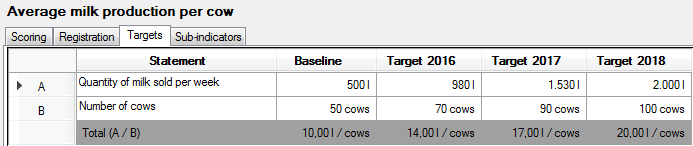
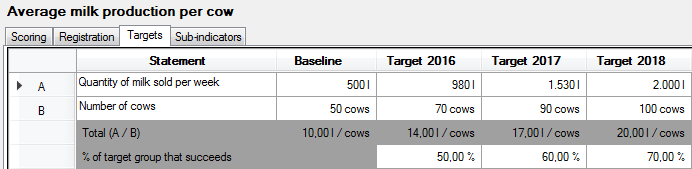
On the Targets tab:
- Specify the target values in the cells of the first row
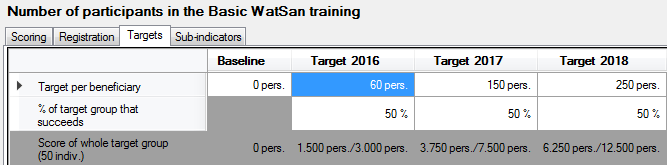
- When you measure at beneficiary level, specify which percentage of the target group you expect to reach that target. On the bottom row Logframer will calculate the total values for the target population.
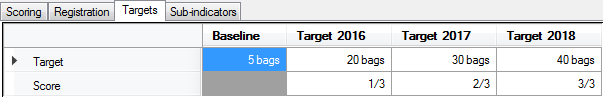
With scoring:
Beneficiary level monitoring:
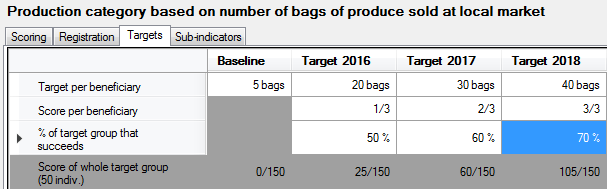
Beneficiary level monitoring with scoring:
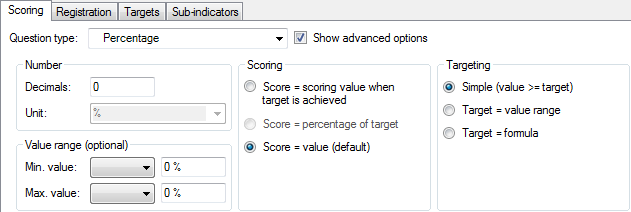
Percentages
On the Scoring tab:
- Number box: indicate the precision (number of decimals). The unit is ‘%’ by default.
- Value range box: You can limit the value range that the respondents can give by specifying a minimum value and/or a maximum value. This means that you can't enter target values that lie outside this value range.
- Scoring and Targeting: see the page on this topic
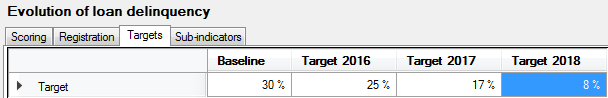
On the Targets tab:
- Specify the target percentages in the cells of the first row
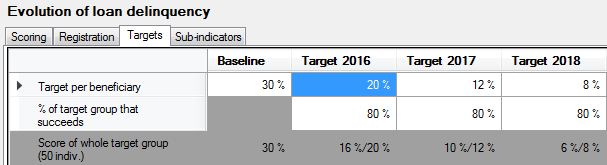
- When you measure at beneficiary level, specify which percentage of the target group you expect to reach that target. On the bottom row Logframer will calculate the total values for the target population.
Beneficiary level monitoring:
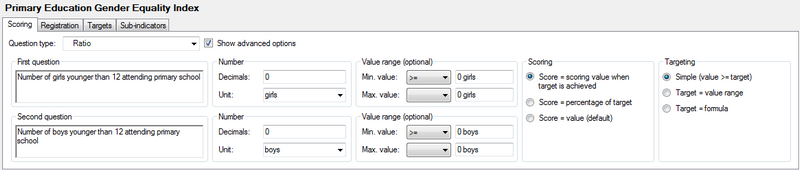
Ratio
To calculate a ratio, the respondent has to answer to two questions. For each question, you can specify the number of decimals, unit and value range.
On the Scoring tab:
- For the first and second question:
- Enter the question in the first question / second question box
- Number box: indicate the precision (number of decimals) and select a unit from the list, or enter a new unit. If you enter a custom unit it will become available for all indicators in the current project (but not in other projects).
- Value range box: You can limit the value range that the respondents can give by specifying a minimum value and/or a maximum value. This means that you can’t enter target values that lie outside this value range.
- Scoring and Targeting: these options concern the total value/score of the indicator, not the individual questions. For more information, see the page on this topic
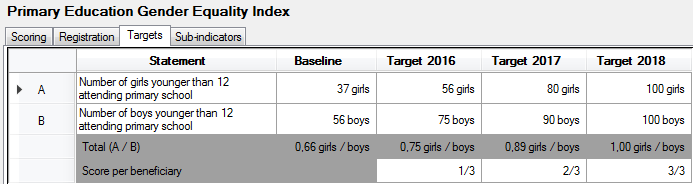
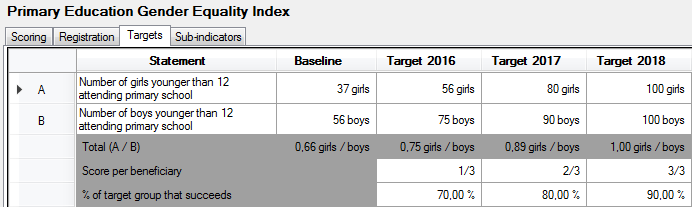
On the Targets tab:
- Specify the target values for the first question in the cells of the first row
- Specify the target values for the second question in the cells of the second row
- Logframer will calculate the ratio in the third row
- When you measure at beneficiary level, specify which percentage of the target group you expect to reach that target. Because the ratio is a kind of average, you won't see another row with total values as you have in other types of indicators.
With scoring:
Beneficiary level monitoring:
Beneficiary level monitoring with scoring:
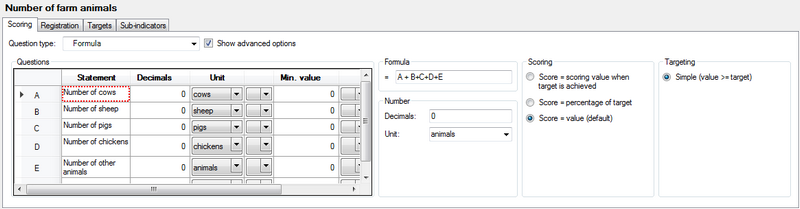
Formula
On the Scoring tab:
- Enter a series of questions or statements in the Questions box.
- For each question you can specify the number of decimals, the unit and a value range (with a minimum value and a maximum value)
- Formula: here you can enter the formula to calculate the total. By default, Logframer will construct an addition of the rows (A+B+C+D…), but you can create your own formulas more or less like you would in Excel:
- Allowed operators: A+B; A-B; A*B; A/B
- Numbers are allowed: A*10
- Brackets are also allowed, for instance: (A+B)/(C+D)
- Excel functions such as SUM, AVERAGE, etc. are NOT allowed
- Number box: specify the precision (number of decimals) and the unit for the result of your formula. Logframer will attempt to determine the unit based on the units of the questions and your formula. For instance: if the unit of question A and question B is ‘kg’ and the unit of question C is ‘m²’ and the formula is (A+B)/C then the resulting unit will be kg/m². However, you can also select a unit from the drop-down list or enter a new unit.
- Scoring: see the page on this topic
- Targeting: for the Formula question type, you can only use values for your targets, not scores.
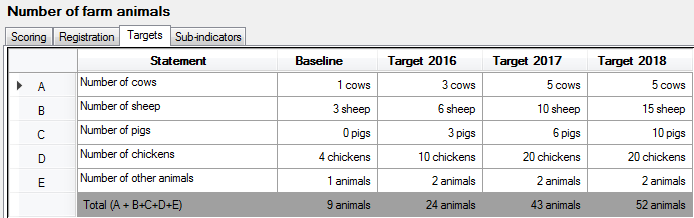
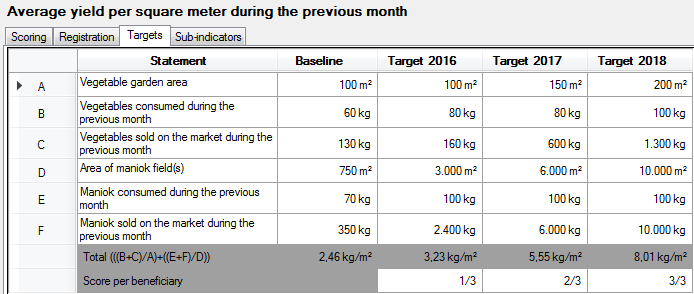
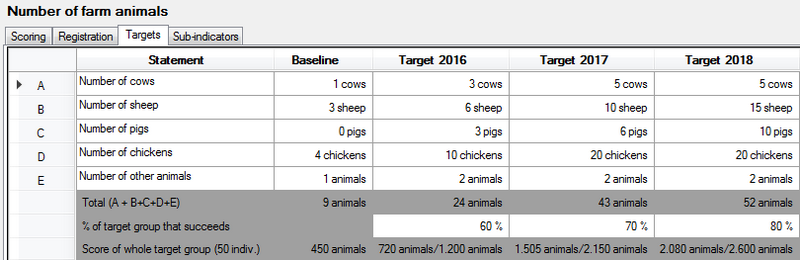
On the Targets tab:
- Specify the target values for the questions in the ‘Baseline’ and ‘Target’ columns
- At the bottom, the resulting total will appear according to your formula
- When you measure at beneficiary level, specify which percentage of the target group you expect to reach that target. On the bottom row Logframer will calculate the total values for the target population.
With scoring:
Beneficiary level monitoring:
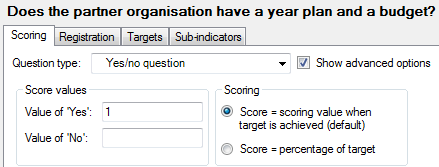
Yes/no question
On the Scoring tab:
- Score values box: enter a value for ‘yes’ and ‘no’ (typically ‘yes’ would be 1 and ‘no’ would be 0). If you want to use values with one or more decimals, use the Number box to set the number of decimals
- Scoring: see the page on this topic
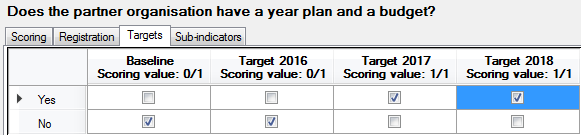
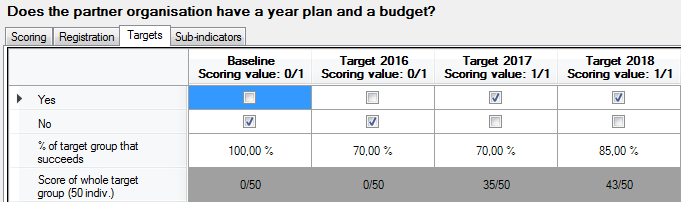
On the Targets tab:
- For the baseline and targets, click in the checkbox next to Yes or No
- When you measure at beneficiary level, specify which percentage of the target group you expect to reach that target. On the bottom row Logframer will calculate the total scores for the target population.
Beneficiary level monitoring:
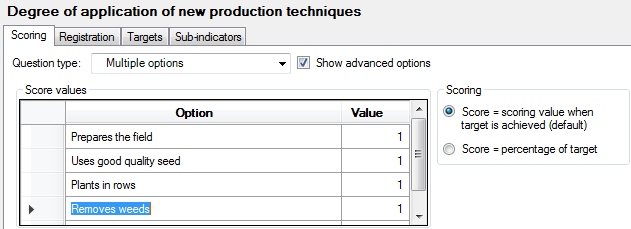
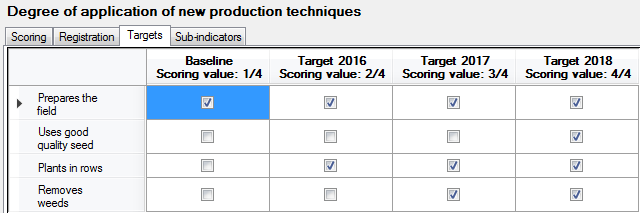
Multiple options
With the Multiple Options question type, the respondent (or interviewer) can select one or more options from a list. If you want to ensure that he/she can only select a single option, use the Multiple Choice question type.
On the Scoring tab:
- Score values box: enter the different options that the respondent will be able to choose from. Then enter a scoring value for each option. If you want to use values with one or more decimals, use the Number box to set the number of decimals
- Scoring: see the page on this topic
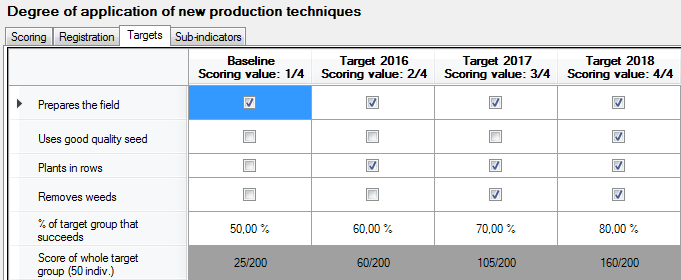
On the Targets tab:
- For the baseline and targets, click in the checkbox next to the relevant options
- When you measure at beneficiary level, specify which percentage of the target group you expect to reach that target. On the bottom row Logframer will calculate the total scores for the target population.
Beneficiary level monitoring:
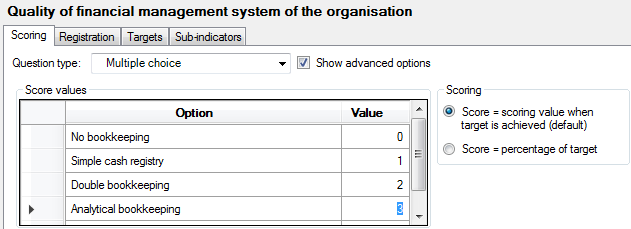
Multiple choice
With the Multiple Choice question type, the respondent (or interviewer) can select only one option from a list. If you want to ensure that he/she can only select a one or more options, use the Multiple Option question type.
On the Scoring tab:
- Score values box: enter the different options that the respondent will be able to choose from. Then enter a scoring value for each option. If you want to use values with one or more decimals, use the Number box to set the number of decimals
- Scoring: see the page on this topic
On the Targets tab:
- For the baseline and targets, click in the checkbox next to the relevant options
- When you measure at beneficiary level, specify which percentage of the target group you expect to reach that target. On the bottom row Logframer will calculate the total scores for the target population.
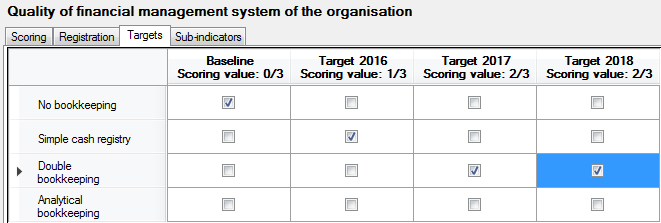
Beneficiary level monitoring:
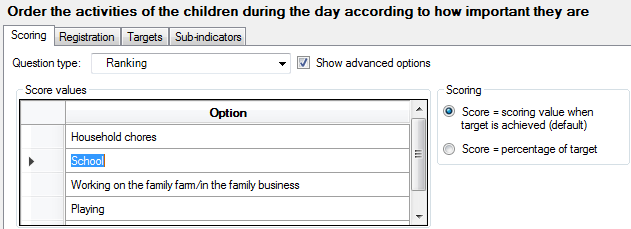
Ranking
On the Scoring tab:
- Score values box: enter the different options that the respondent will be able to choose from.
- Scoring: see the page on this topic
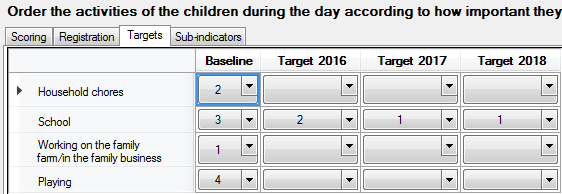
On the Targets tab:
- For the baseline and targets, use the drop-down list of the cells to select the order of preference of the respondent. You can select a value between 0 and the number of options you specified on the Scoring tab. For the targets it can be difficult to precisely predict the order in which the respondent will answer. So you may just focus on the most important item (target item) and show how it will evolve over time.
- When you measure at beneficiary level, you cannot specify the percentage of the target group as you would for other types of questions.
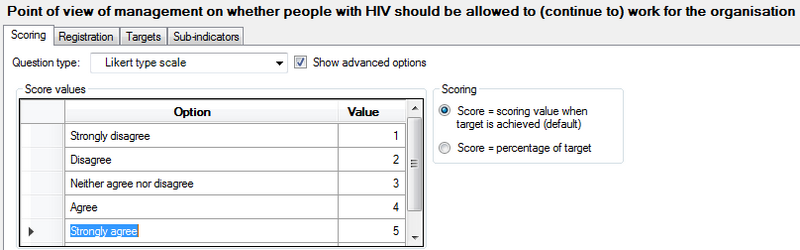
Likert type scale
The difference between the Likert-type scale and a full-blown Likert scale is that the Likert-type scale only uses a five-point (or seven-point, or whatever you prefer) to answer on a single question. A full-blown Likert scale on the other hand uses a series of statements that explore different dimensions of a subject.
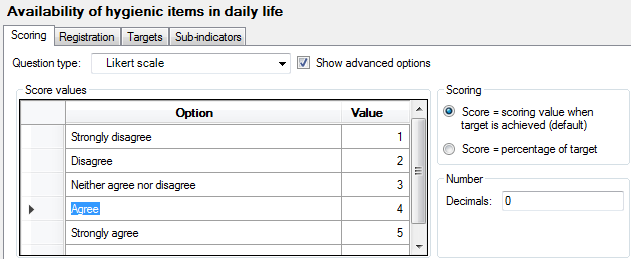
On the Scoring tab:
- Score values box: enter the different Likert scale options that the respondent will be able to choose from. A typical Likert scale has five or seven options (five-point Likert scale or seven-point Likert scale), which means that there is a neutral option in the middle. But you can also use an even number of options and use more or less options than five or seven. For example:
- Strongly disagree – disagree – neutral – agree – strongly agree
- Very good – good – bad – very bad
- Enter a scoring value for each option. If you want to use values with one or more decimals, use the Number box to set the number of decimals
- Scoring: see the page on this topic
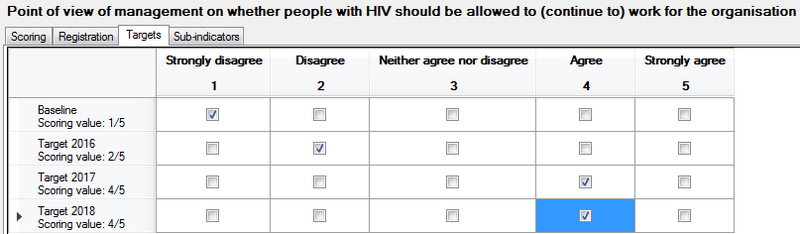
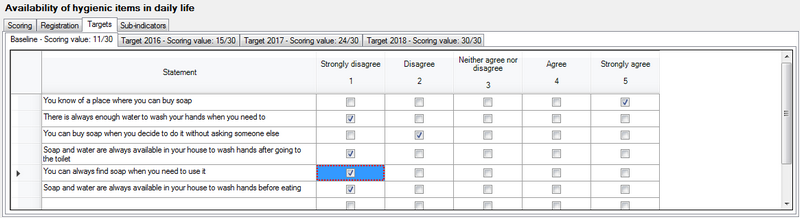
On the Targets tab:
- For the baseline and targets, click in the checkbox under to the relevant option. You can only select one option.
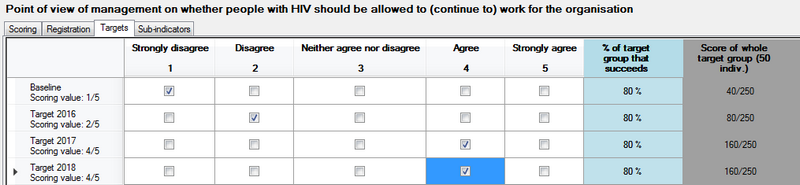
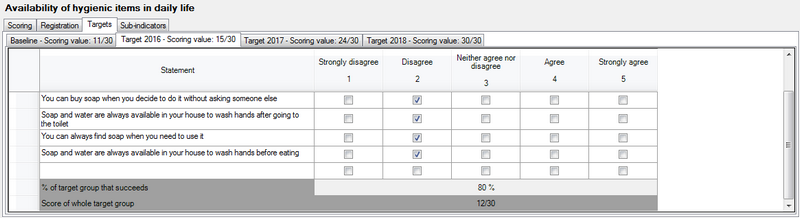
- When you measure at beneficiary level, specify which percentage of the target group you expect to reach that target in the column on the right. In the far right column Logframer will calculate the total scores for the target population.
Beneficiary level monitoring:
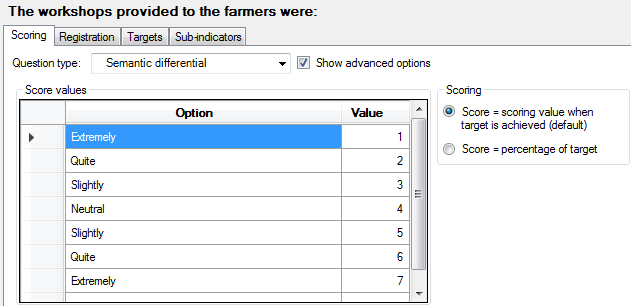
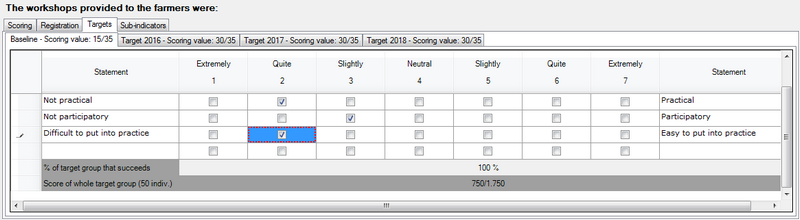
Semantic differential
A semantic uses pairs of adjectives to measure a person's attitude towards something. For instance: ‘The workshops on sustainable organic fertilizers were:’
- Not interesting – Interesting
- Not to the point – to the point
- Not practical – Practical
- Not participatory – Participatory
- Difficult to put into practice – Easy to put into practice
To answer, the respondent can use a series of options that allow him/her to express different degrees of agreement with one of the two extremes. If you use an uneven number of options you can use a ‘Neutral’ option in the middle.
On the Scoring tab:
- Score values box: enter the items (degrees) of the scale that the respondent will be able to choose from. These items specify the adjectives that the respondent can choose from and mirror each other, for example:
- Extremely – quite – slightly – neutral – slightly – quite - extremely
- Very – a bit – neutral – a bit - very
- Enter a scoring value for each option. If you want to use values with one or more decimals, use the Number box to set the number of decimals
- Scoring: see the page on this topic
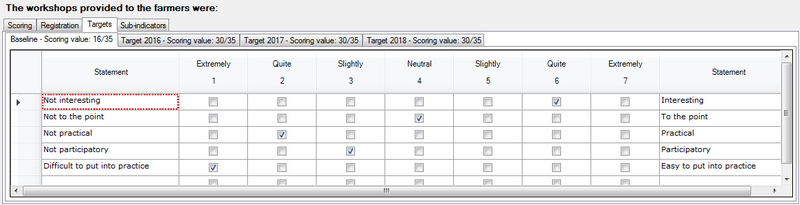
On the Targets tab:
- The Targets tab is divided in another series of tabs: one for the baseline and one for each target
- Add statements by entering the adjective pairs in the first and last column (Statement columns). When you enter or modify statements in the Baseline tab they will automatically be copied to the targets.
- Select one of the checkboxes for each statement.
- When you measure at beneficiary level, specify which percentage of the target group you expect to reach that target. On the bottom row Logframer will calculate the total scores for the target population.
Beneficiary level monitoring:
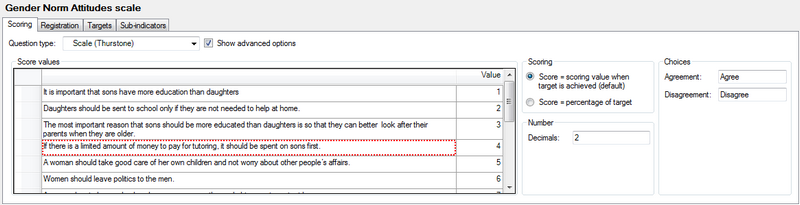
Scale (Thurstone)
The method of equal-appearing intervals or the Thurstone scale is used to measure attitudes of people. Logframer allows you to use a Thurstone scale to measure an indicator, but developing such a scale is not so simple.
This kind of scale is used to measure people's attitude towards a fairly clear and unidimensional concept, using a number of statements that vary in how they express a positive or negative opinion about the main concept. We'll briefly explain the steps of developing a Thurstone scale:
- Determine the focus: what concept are you going to measure (see what people's attitudes are toward it)?
- Ask a group of people (or a person) to write down different statements about this concept, reflecting different opinions or attitudes about the subject. Make sure you have a large number of statements, making sure that people can either degree or disagree with them (no - open - questions for instance).
- Rating the scale items: the next step is to have your group rate each statement on a 1-to-11 scale in terms of how much each statement indicates a favourable attitude towards the concept. The members of the group must not express their own opinion, they must only indicate how favourable they feel each statement is. You can use a scale with 1 = extremely favourable attitude towards the subject (focus) and 11 = extremely unfavourable attitude towards the subject.
- Compute the median and interquartile range for each statement. Create a table with these values and sort by the median.
- Select the items for the actual scale: you should select statements that are at equal intervals across the range of medians. Within each value, you should try to select the statement that has the smallest Interquartile Range. This is the statement with the least amount of variability across judges. You don't want the statistical analysis to be the only deciding factor here. Look over the candidate statements at each level and select the statement that makes the most sense. If you find that the best statistical choice is a confusing statement, select the next best choice.
- For a detailed example, see http://www.socialresearchmethods.net/kb/scalthur.php
You can now use the scale to measure attitudes 'in the field': enter the list of statements and use them to interview people or present them in a document. For each item, they should express whether they agree or disagree. The total score of a person is calculated by making the sum of the values of all the statements they agreed with, divided by the number of items he agreed on (in other words, the average of the statements they agreed with).
On the Scoring tab:
- Score values box: list the different statement to which the respondent can agree or disagree. Then enter a scoring value for each statement.
- Scoring: see the page on this topic
- Number box: select the number of decimals for the total scoring value of the baseline/targets. Since this total score is a division (the sum of the values of the agreed statements divided by the number of statements agreed on), you may want to choose for 1 or 2 decimals.
- Choices box: By default, agreement is expressed by ‘Agree’ and disagreement with ‘Disagree’, but you can change these options here.
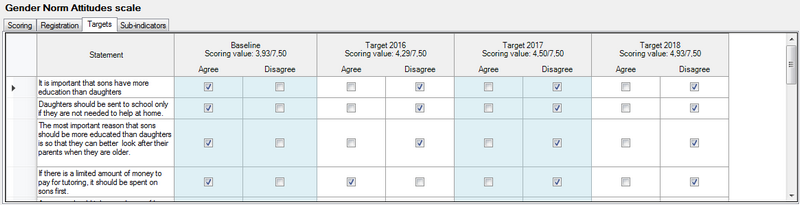
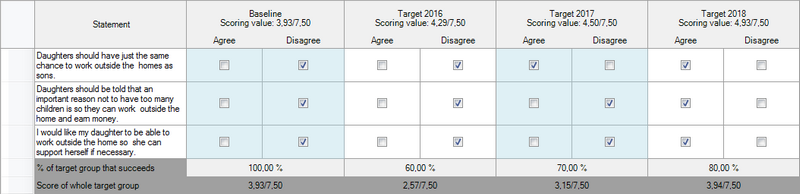
On the Targets tab:
- For each statement, click in the checkbox of the ‘Agree’ or the ‘Disagree’ column. The total scoring value is shown at the top of the column.
- When you measure at beneficiary level, specify which percentage of the target group you expect to reach that target. On the bottom row Logframer will calculate the total scores for the target population.
Likert scale
The difference between a full-blown Likert scale and a Likert-type scale is that the Likert-type scale only uses a five-point (or seven-point, or whatever you prefer) to answer on a single question. A full-blown Likert scale on the other hand uses a series of statements that explore different dimensions of a subject.
The Likert scale can also be used to measure attitudes of people. When responding to a Likert questionnaire item, respondents specify their level of agreement or disagreement on a symmetric agree-disagree scale for a series of statements. Thus, the range captures the intensity of their feelings for a given item. As with the Thurstone scale, the development of a Likert scale takes some effort.
A Likert scale uses a number of Likert items, which are statements to which a respondent expresses his agreement or disagreement. Generally, a five-point or seven-point scale is used, for instance:
- Strongly agree
- Agree
- Neutral
- Disagree
- Strongly disagree
As you can see, each item is bipolar: it measures either someone's agreement or disagreement to the statement and allows you to give some measure of how much you agree or disagree. There is a variety of possible response scales (5-point; 7-point; 4-point…). All of these odd-numbered scales have a middle value is often labelled ‘Neutral’ or ‘Undecided’. It is also possible to use a forced-choice response scale with an even number of responses and no central neutral choice. In this situation, the respondent is forced to decide whether they lean more towards the agree or disagree end of the scale for each item.
The basic steps of developing a Likert scale are:
- Determine the focus: what concept are you going to measure (see what people's attitudes are toward it)?
- Ask a group of people (or a person) to write down different statements about this concept, reflecting different opinions or attitudes about the subject. Make sure you have a large number of statements, making sure that people can express their degree of agreement or disagreement on a five or seven-point scale.
- Rating the scale items: the next step is to have your group rate each statement on your five-point (or seven-point, or 10-point) scale in terms of how much each statement indicates a favourable or unfavourable attitude towards the concept. The members of the group must not express their own opinion, they must only indicate how favourable or unfavourable they feel each statement is. All statements (Likert items) in the Likert scale must use the same number of points on the scale (so either a 5-point scale, or a 7-point scale, but not a mix of the two).
- Select the items for the actual scale: The next step is to compute the intercorrelations between all pairs of items, based on the ratings of the judges. In making judgements about which items to retain for the final scale there are several analyses you can:
- Throw out any items that have a low correlation with the total (summed) score across all items
- For each item, get the average rating for the top quarter of judges and the bottom quarter. Then, do a T-test of the differences between the mean value for the item for the top and bottom quarter judges.
- Correlation between the items and the total score: In most statistics packages it is relatively easy to compute this type of Item-Total correlation. First, you create a new variable which is the sum of all of the individual items for each respondent. Then, you include this variable in the correlation matrix computation (if you include it as the last variable in the list, the resulting Item-Total correlations will all be the last line of the correlation matrix and will be easy to spot). How low should the correlation be for you to throw out the item? There is no fixed rule here -- you might eliminate all items with a correlation with the total score less than .6, for example.
- T-test: Higher t-values mean that there is a greater difference between the highest and lowest judges. In more practical terms, items with higher t-values are better discriminators, so you want to keep these items. In the end, you will have to use your judgement about which items are most sensibly retained. You want a relatively small number of items on your final scale (e.g., 10-15) and you want them to have high Item-Total correlations and high discrimination (e.g., high t-values).
- For a detailed example, see http://www.socialresearchmethods.net/kb/scallik.php
You can now use the scale to measure attitudes in the field: enter the list of statements and use them to interview people or present them in a document. For each item, they should express to what degree they agree or disagree.
The final score for the respondent on the scale is the sum of their ratings for all of the items (this is why this is sometimes called a summative scale). On some scales, you will have items that are reversed in meaning from the overall direction of the scale. These are called reversal items. You will need to reverse the response value for each of these items before summing for the total. That is, if the respondent gave a 1, you make it a 5; if they gave a 2 you make it a 4; 3 = 3; 4 = 2; and, 5 = 1.
On the Scoring tab:
- Score values box: enter the different Likert scale options that the respondent will be able to choose from. A typical Likert scale has five or seven options (five-point Likert scale or seven-point Likert scale), which means that there is a neutral option in the middle. But you can also use an even number of options and use more or less options than five or seven. For example:
- Strongly disagree – disagree – neutral – agree – strongly agree
- Very good – good – bad – very bad
- Enter a scoring value for each option.
- Scoring: see the page on this topic
- Number box: select the number of decimals for the total scoring value of the baseline/targets.
On the Targets tab:
- The Targets tab is divided in another series of tabs: one for the baseline and one for each target
- Add statements in the first column (Statement column). When you enter or modify statements in the Baseline tab they will automatically be copied to the targets.
- Select one of the checkboxes for each statement. The total score for the baseline or target is displayed in the tab header.
- When you measure at beneficiary level, specify which percentage of the target group you expect to reach that target. On the bottom row Logframer will calculate the total scores for the target population.
Cumulative scale (Guttman)
The cumulative scale or Guttman scale measures to what degree a person has a positive or negative attitude to something. It makes use of a series of statements that are growing or descending in how positive or negative a person is towards the subject. If for instance on a scale with seven statements the respondent agrees with the fifth statement, it implies that he or she also agrees with the first four statements, but not with statement number six and seven.
To create a Guttman scale, you need to:
- Determine the focus: what concept are you going to measure (see what people's attitudes are toward it)?
- Ask a group of people (or a person) to write down different statements about this concept, reflecting different opinions or attitudes about the subject. Make sure you have a large number of statements, making sure that people can either degree or disagree with them (no - open - questions for instance).
- Rating the scale items: the next step is to have your judges rate each statement, indicating whether the statement expresses a positive (favourable) or negative (unfavourable) attitude towards the concept. The members of the group must not express their own opinion about the concept, they must only indicate whether the statement is favourable or unfavourable.
- Developing the scale: construct a matrix or table that shows the responses of all the respondents on all of the items. Then sort this matrix so that respondents who agree with more statements are listed at the top and those agreeing with fewer are at the bottom. For respondents with the same number of agreements, sort the statements from left to right from those that most agreed to those that fewest agreed to.
- If there are lots of items, you need to use a data analysis called scalogram analysis to determine the subsets of items from our pool that best approximate the cumulative property. Then review these items and select the final scale elements. There are several statistical techniques for examining the table to find a cumulative scale.
- Because there is seldom a perfectly cumulative scale you usually have to test how good it is. These statistics also estimate a scale score value for each item. This scale score is used in the final calculation of a respondent's score.
- For a detailed example, see http://www.socialresearchmethods.net/kb/scalgutt.php
You can now use the scale to measure attitudes 'in the field': enter the list of statements and use them to interview people or present them in a document. For each item, they should express whether they agree or disagree. Each scale item has a scale value associated with it (obtained from the scalogram analysis).
To compute a respondent's scale score we simply sum the scale values of every item they agree with.
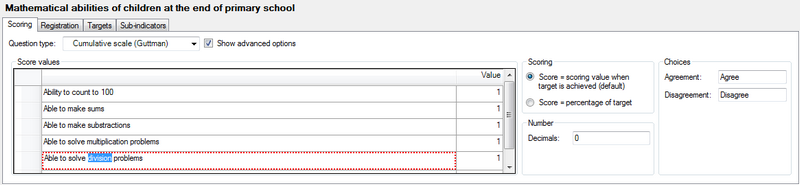
On the Scoring tab:
- Score values box: list the different statement to which the respondent can agree or disagree. Then enter a scoring value for each statement.
- Scoring: see the page on this topic
- Number box: select the number of decimals for the total scoring value of the baseline/targets.
- Choices box: By default, agreement is expressed by ‘Agree’ and disagreement with ‘Disagree’, but you can change these options here.
On the Targets tab:
- For each statement, click in the checkbox of the ‘Agree’ or the ‘Disagree’ column. The total scoring value is shown at the top of the column.
- When you measure at beneficiary level, specify which percentage of the target group you expect to reach that target. On the bottom row Logframer will calculate the total scores for the target population.
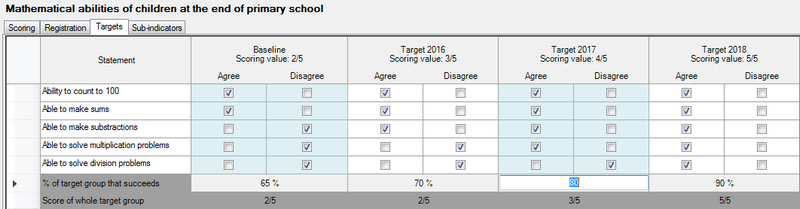
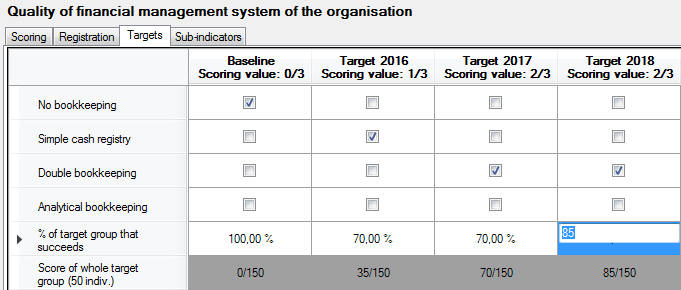
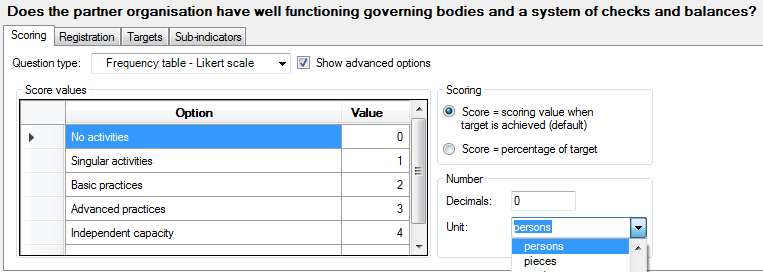
Frequency table - Likert scale
If you interview a whole group of people at a time or you work with total numbers of different groups (classes) of something, you may want to work with this version of the Likert scale. It works exactly as the Likert scale, but you enter numbers instead of checking options.
On the Scoring tab:
- Score values box: enter the different Likert scale options that the respondent will be able to choose from. A typical Likert scale has five or seven options (five-point Likert scale or seven-point Likert scale), which means that there is a neutral option in the middle. But you can also use an even number of options and use more or less options than five or seven. For example:
- Strongly disagree – strongly agree – neutral – agree – strongly agree
- Very good – good – bad – very bad
- Enter a scoring value for each option.
- Scoring: see the page on this topic
- Number box: select the number of decimals for the total scoring value of the baseline/targets. You can also select a unit from the list, or enter a new unit. If you enter a custom unit it will become available for all indicators in the current project (but not in other projects).
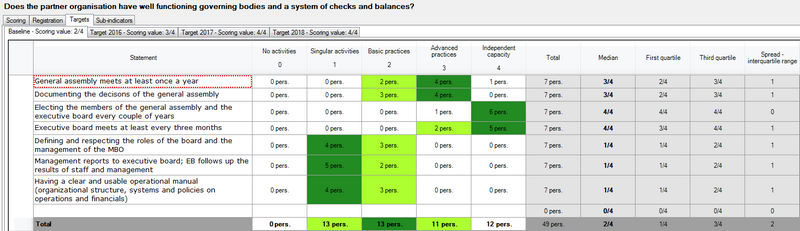
On the Targets tab:
- The Targets tab is divided in another series of tabs: one for the baseline and one for each target
- Add statements in the first column (Statement column). When you enter or modify statements in the Baseline tab they will automatically be copied to the targets.
- For each statement and each point on the scale, enter the number (frequency). The score for the statement is the median class (indicated in dark green). Logframer will also show the first and third quartile in light green, which means you can see the spread in the form of the Interquartile range.
- The total score (median and spread) for the baseline or targets is shown at the bottom of the table. The score is also displayed in the tab header.
- When you measure at beneficiary level, specify which percentage of the target group you expect to reach that target. On the bottom row Logframer will calculate the total scores for the target population.
Images with targets
On the Targets tab:
- The baseline and targets are on separate tabs
- Click on Open document icon next to URL to select the picture that you want to open
- You can add a description of the picture