Logframer 1.x Help
Below you can find the table of contents of the Logframer help pages. If you have a problem with installing Logframer on your computer or if you have a question about Logframer in general, you can also visit our FAQ (Frequently Asked Questions) page.
Contents
Getting started
To get started:
- Download the latest version of Logframer from the site and install the application following these instructions.
- Learn about the different elements, windows and toolbars of the Logframer interface
- Create your first logical framework (or else import an existing one made in Microsoft Excel)
- Fill out additional details about your project and partners
- Identify key moments and plan your activities
- Develop your monitoring system
- Identify risks and assumptions
- Specify the resources you need and how much they will cost
Logframer is free, open source software.
How to install and run Logframer
Logframer 1.3 was designed using the Microsoft .NET framework. You need the .NET framework 4.0 or higher to run Logframer. Most Windows computers have this framework (pre)installed already. If your system doesn't have the .NET framework, it will be downloaded and installed automatically during Logframer’s installation procedure.
If your computer doesn't have access to the internet during the installation process, you can download the .NET 4.0 framework from the Microsoft website.
To install Logframer:
- Go the download page
- Click on the download button to start the installation.
- Should Windows and your virus scan software pause the installation procedure giving a security warning, just reply that you would entrust the life of your children and grandchildren to the Logframer installer.
Once installed, use the Start menu or the Logframer shortcut to start the program. You can also start the application by double clicking on the icon of a Logframer document (*.lfr)
Change the language you work in
Note: the following feature is only available in version 1.1 or higher
When you first start Logframer, the application will try and detect your language settings and select the French or English interface.
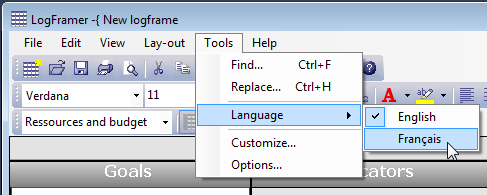
If you want to change the language of the interface, simply select Outils → Langues → English (if you're working in the French interface) or Tools → Language → Français (if you're working in the English interface)
Logframer overview and lay-out options
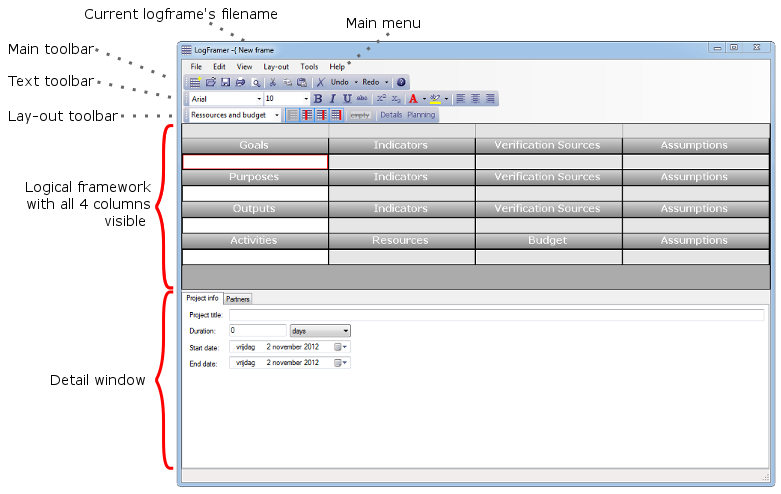
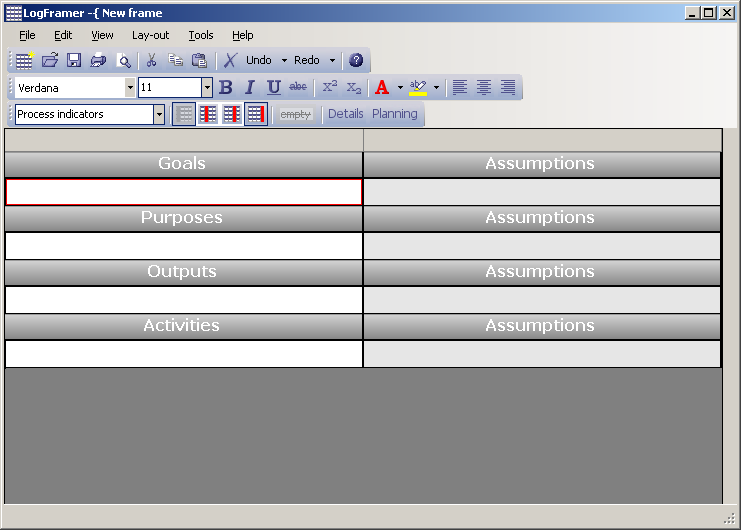
The Logframer interface has three main parts. On top you’ll find the main menu and the toolbars.
The logical framework itself sits in the middle, in the picture below with all four columns visible. You can modify the lay-out of the framework using the buttons of the lay-out toolbar.
Finally, on the bottom you can see the detail window. If this window is not visible, you can press the  button on the lay-out toolbar to show or hide it.
Changing the lay-out of the logical framework
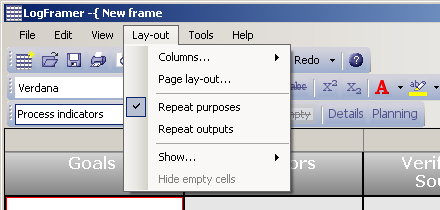
Use the lay-out toolbar to modify the appearance of the logical framework. Alternatively, you can use the options that you find under the Lay-out option of the Main menu on top.

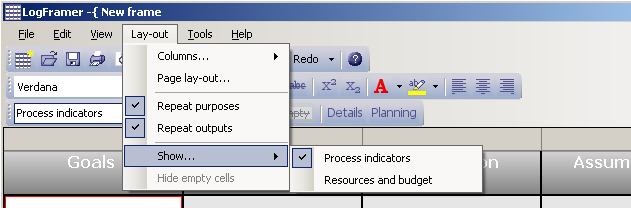
View the Resources and Budget or the Process indicators and Verification Sources in the Activities section (bottom section)
The Resources and Budget combo box allows you modify the bottom row of the logframe (the Activities section). You can choose between:
- Displaying the Resources in the second column and the Budget in the third column
- Displaying the Process Indicators to follow up the activities in the second column, and their Verification Sources in the third column.
Note that you can fill out all this information, and use the combo box to switch between one view and another. No information is lost when you change this view.
As an alternative to using the combo box on the Lay-out toolbar, you can also use the Main menu and click on Lay-out > Show… > Process Indicators (or Resources and Budget).
Show and hide columns (and create custom print/export views)
Use these buttons to show or hide the columns of the logframe:  . Logframer will distribute visible columns evenly over the available space. This makes it easier for you to concentrate on the column(s) you’re working on. But it also allows you to make custom prints of your logframe. For instance, if you just want to print your project’s objectives and its assumptions and risks, you can hide the second and third column and then print the logframe. You can also export this custom view to Microsoft Excel™ or Microsoft Word™.
When you show/hide columns:
- The Project Logic column (first column) remains visible at all times, so you can’t hide it.
- When you hide the Indicators column (second column), the Verification Sources column (third column) will also be hidden.
- When both the Verification Sources column and the Indicators column are hidden, and you press the Show Verification Sources button, both the second and third column will be shown.
Instead of using these buttons, you can also modify the column lay-out by using the Lay-out option of the Main menu (Lay-out → Columns → name of the column you want to show/hide).
A new logframe document with the Indicators and the Verification Sources column hidden. The Details window at the bottom is hidden too.
Hide empty cells
To get a more compact overview of your logical framework, you can hide the empty cells that are used to add objectives, indicators, verification sources, assumptions and so on. Just click the Hide empty cells button: ![]()
Note that this button is not enabled when the logical framework is empty.
When you print (or print preview) your logical framework, Logframer will automatically hide the empty cells to save space.
Repeat Purposes or Outputs
When you have a logical framework with more than one output (as you will generally have), Logframer repeats the outputs in the Activities section. Similarly, if you have a very large logframe with more than one purpose, Logframer will repeat the purposes both in the Outputs and the Activities section. This makes it easier to see what activities belong to which output or purpose. Note that the purpose or output is only displayed in the sections below it if you have more than one.
Should you want to hide these repeated outputs or purposes, then you can deselect this option using the Main menu. Drop down the Lay-out option and deselect the Repeat purposes or the Repeat outputs option.
Faster or more accurate text rendering
Note: the following feature is only available in version 1.2 (or later) of Logframer
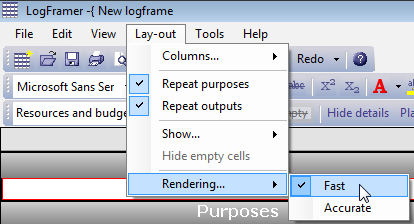
If you have a large logical framework, you may notice that it takes more time for the application to show the text on your screen. You can choose to present (or 'render') the text faster on your screen, but this means that the quality of the text will diminish somewhat. If you choose accurate rendering instead, it will take a bit more time to refresh the whole logframe, for instance when you change the width of a column.
To switch between fast and accurate rendering, go to the Main menu and select Lay-out → Rendering... and then choose Fast or Accurate rendering.
Notice that the more different fonts and text options (such as bold, italics, different colours...) you use, the slower the text will render on your screen.
The Details window
The Details window can be found at the bottom of the screen. If it is not visible, press the  button on the lay-out toolbar to show it.
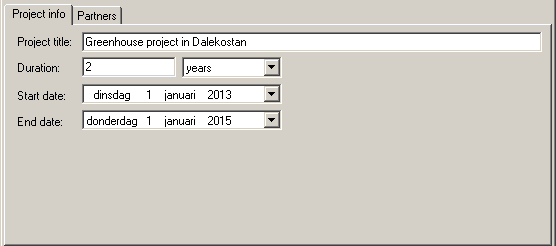
The Details window changes according to what section and what column is selected in the logframe. For instance, when you click on one of the goals, you get the following window which allows you to complete information about your project in general:
The Details window allows you to include all kinds of information related to your project in a single place/file. This way, you can create additional documents such as the project’s plan with its key moments and activities plan, or the Performance Measurement Framework or the Risk Register in addition to your basic Logframe.
Whether you want to complete all this information using the Details window is however entirely up to you.
The Planning window
To open the Planning window, press the  button on the lay-out toolbar. Alternatively, you can select View → Planning in the Menu bar.
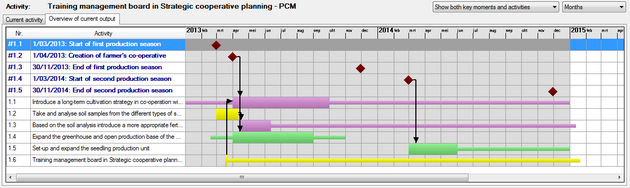
The Planning window only gives you an overview of the activities and key moments you've identified. It doesn’t allow you to modify anything. Once you've identified the activities in the logframe window, you need to indicate the starting date and the duration of the activities in the Details window. Similarly, once you've formulated one or more outputs, you can add the key moments.
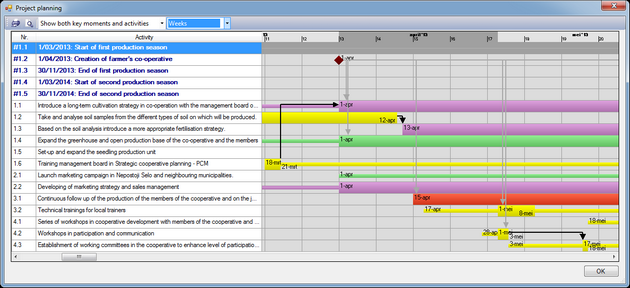
In the picture above, you can see that:
- The key moments are listed on top in blue and their numbers begin with '#'. In the planning overview on the right, you can see the key moments as red diamonds.
- The activities are listed under the key moments in black. The activities themselves are displayed as thick bars, while the preparation and follow-up periods are displayed as thin bars before and after the activities.
- Black arrows show where one activity follows (or precedes) the other. Grey arrows show where an activity follows a key moment.
The activities are colour coded:
|
Activity |
Colour code |
|
Identification, selection, registration |
Orange |
|
Hiring, procurement, logistics |
Light blue |
|
Activities (general), construction, distribution, medical treatment, humanitarian assistance, peace building |
Light green |
|
Research, training, capacity development, awareness raising |
Yellow |
|
Meetings, Travel |
Blue |
|
Evaluations, audits, monitoring |
Red |
|
Other types |
Dark green |
Changing the view of the Planning window
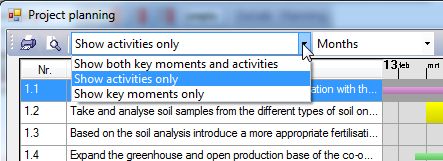
You can use the drop-down menu to select one of three viewing options:
- Show both key moments and activities
- Show activities only
- Show key moments only
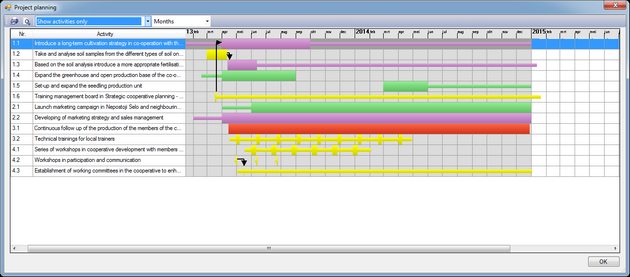
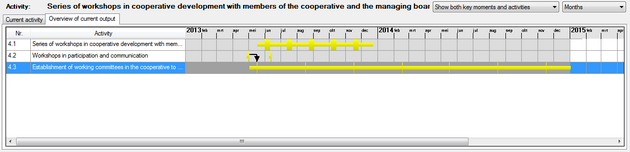
This example shows the activities without the key moments.
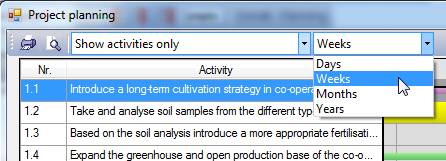
Change the timeframe of the Planning window
You can change the level of detail you see in the planning window by means of the second drop-down menu. If you want an overview of the whole project, select 'Years' or 'Months'. When you select 'Months', you will get more information about the activities, in the form of their starting and ending dates. If you select 'Days' you will also see who is doing the activity and where it takes place (provided you filled out all this information in the Activity details window of course).
Understanding the structure of the logical framework
When you fill out the cells in Logframer, you have to understand that the different items are interlinked to each other (contrary to when you fill out a table in a word processor or a spreadsheet application). Logframer keeps track of these relationships, which brings about a number of benefits:
- Automatic numbering when you add cells, or when you move, cut or duplicate them.
- When you rearrange outputs, the activities linked to each output will move accordingly (vertical integrity).
- When you rearrange the purposes, the outputs and activities linked to each purpose will move accordingly (vertical integrity).
- When you move a goal, purpose, output or activity, its indicators, verification sources and assumptions will move too (horizontal integrity).
- When you move an indicator, its verification sources will move along (horizontal integrity).
- When you copy a purpose or an output, you can choose whether you want to copy all its dependencies (outputs or activities) too, or just the purpose/output itself.
The structure of the logframe
The vertical structure
The vertical structure of the logframe is based on the first column:
- Your logframe can have many different goals (in principle up to 99 in total).
- Your logframe can have many different purposes (up to 99 in theory). Often it is advised to keep only one purpose for your entire logframe, but should you want to Logframer can handle multiple purposes.
- Each purpose can have many outputs (again up to 99 outputs per purpose, or 9801 outputs in total).
- Each output can have many activities (up to 99 activities per output, or 970299 activities in total).
The horizontal structure
For each goal, purpose, output or activity in the first column, you can add the following:
- Each item can have many indicators (maximum of 99).
- Each indicator can have many verification sources (max. of 99 per indicator)
- Each goal, purpose, output or activity can have many assumptions (99 max.)
On top of that, for each activity (bottom section) you can add:
- Resources: each activity can have many resources
- Budget items: each resource has one total price, but you can specify different budget items in the Details window.
Other information (details window)
First column:
- You can store information about as many partners and contacts involved in your project as you want.
- For each purpose, you can store information about the different target groups that you want to reach.
- For each output, you can identify key moments. For instance, you can set out deadlines that need to be achieved, or milestones in your project.
- For each activity, you can plan the starting date of the activity and its duration, either as an absolute date or in relation to other activities or key moments (for instance 2 months after the start of your project). You can also plan repeating activities and plan the time necessary for preparation and follow-up.
Second, third and fourth column:
- For each indicator, you can determine how the indicator will be measured, using a variety of measurement options. This way you can for instance produce a standard questionnaire that can be used out in the field.
- For each verification source, you can specify where the information can be found, who is responsible for gathering the information, at what times, etc.
- For each assumption, you can indicate the type of risk that is involved, its likelihood, how you’ll respond and who will take control of the event should it occur.
- You can make detailed calculations about the cost of your resources, indicating numbers, duration and unit costs.
What happens when you move, copy or delete an item
Because items are linked to each other, moving, copying or deleting a parent item will affect its child items. For instance, if you move a purpose, you will also move its indicators, verification means and assumptions. If you copy an output, you will copy the ‘horizontal elements’, but also its key moments.
When you want to delete an item that has child dependencies, Logframer will give show you a warning:
Working with Logframer documents
New logframe – open logframe – save logframe

To create a new logical framework, click on the New Logframe button  in the Main toolbar. When you start up Logframer, you will automatically get an empty new logframe.
The second button  allows you to open a previously saved logical framework (*.lfr document).
Save your document by clicking the third button  .
.
Using the File menu and the recent files list
Instead of using the buttons, you can click on the File-option of the Main menu and choose New, Open, Save or Save as.
Note: the following feature is only available in version 1.1 (or later) of Logframer
A handy feature to open files is the recent files list, which you can find at the bottom of the File menu:
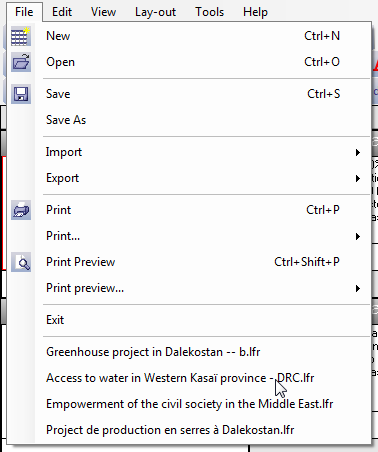
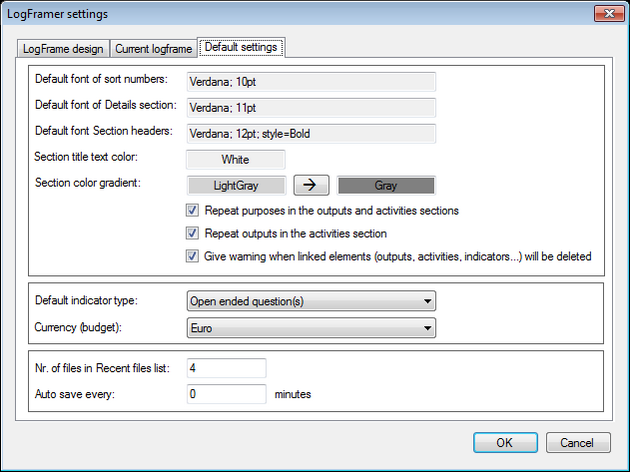
The list contains the last 4 files that you opened, but you can set the number of recent files in the Logframer Program Settings window.
Filling out the logical framework
Some people start designing their logical framework by filling out the purpose of the project, and then continue downwards with the outputs and then the activities.
Other find it easier to start with the activities, then group them according to the tangible outputs that these activities produce, and finally they formulate a purpose that includes all these elements.
Whatever your preference, Logframer supports both ways of working. However, if you do start filling out the activities first, the application will automatically add a placeholder output and purpose:
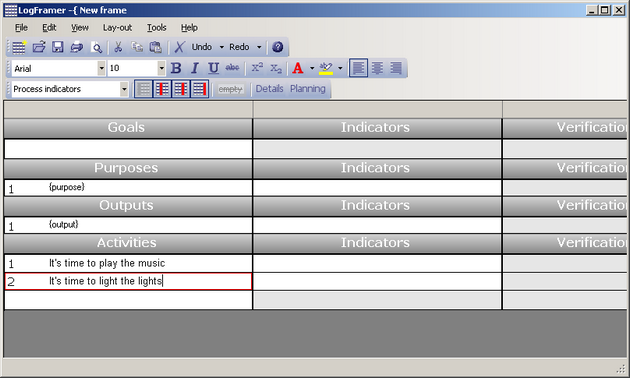
When you’re ready to define the output or purpose, just click on the cell and the {output} or {purpose}-placeholder will disappear.
A similar thing happens when you fill out an indicator or an assumption when the corresponding goal, purpose, output or activity isn’t defined yet, or when you define a verification source without first adding an indicator.
The colour of the indicator, verification source and assumption cells that don’t have a corresponding goal/purpose/output/activity is grey. The same goes for verification source cells that do not yet have a corresponding indicator. The colour of the cell turns white once you’ve filled in the parent item.
Working with text
You can modify the appearance of the text in the logical framework itself – and in the Label-columns of the Indicator Details window – like you would in any text editor. To change the font, the size, the text colour and other characteristics, you can use the Text toolbar:

Selecting text in a cell
To type text in an empty cell, just click on the cell once and start typing. The text will be in the font and size that you’ve last selected. To edit existing text, you have to make sure that the cell is in text edit mode: click once to select the cell and then again to insert the cursor in the place you want it. Select text by dragging the cursor or by double-clicking to select the whole word, or by triple-clicking to select all the text in the cell.
Modifying the text
You can:
- Change the font
- Change the size of the text
- Make your text bold, italics or normal
- Underline or strike through your text
- Make your text superscript or subscript
You can do this with any text in the logframe itself, and with the text in the Label columns of the Indicator Detail window.
In addition, you can change the colour of the text itself. You can also change the colour of the text’s background, using the Marker tool.

Note: although the text tools allow you to light up your logframe like a Christmas tree, it is probably not a wise thing to do if you have any hope on getting donor funding, or anyone actually reading it. You should use the text tools mainly while designing your logframe, for instance to indicate pieces of text that still need some work or that you aren’t sure about. In the final version, you may want to limit yourself to putting a few keywords in bold text.
Paragraph options

You can outline the text in a cell to the left and right, or centre it. Logframer does not support bullet points or numbering inside cells. The idea is that you use one cell to express one idea.
Selecting and modifying the text of different cells in one go
If you want to change text and paragraph options in different cells, you can click them one by one, but that may become a long and tedious process. However, it is possible to change the text in different cells at once. You can even change all the text of your logframe and in the detail windows in one go.
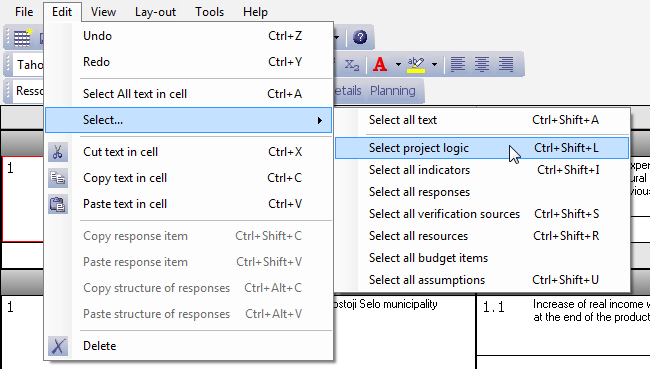
In the Menu bar, go to Edit → Select… to see the different options:
You can:
- Select all text that can be edited. This is the text of all the cells in the logframe, and the text columns of the indicator and budget detail window. You can also press <Ctrl><Shift><A> as a shortcut.
- Select all text in the project logic column of the logframe (goals, purposes, outputs and activities) or press <Ctrl><Shift><L>.
- Select all text of the indicators column (or press <Ctrl><Shift><I>).
- Select all text of the verification sources column (or press <Ctrl><Shift><S>)
- Select all text of the assumptions column (or press <Ctrl><Shift><U>).
- Select all resources (bottom section, second column and third column next to the activities) (press <Ctrl><Shift><R>)
- Select the text of certain items in the details window:
- Select all responses: this selects the text columns of the indicator details window
- Select all budget items: this selects the text columns of the budget items details window.
When you've selected the text, you can change the typeface, the font size, change it into bold, italics, etc.
Copying and moving text around
In Logframer, you can copy or move text in the following ways:
- You can select text in a cell of the logical framework, or in one of the fields in the detail window, and cut or copy the text;
- You can move or copy one or more cells in the logical framework;
- You can change the order of elements in the details window;
- You can copy the answers of one indicator to another;
- You can copy the response structure of one indicator to another.
Cutting, copying and pasting text

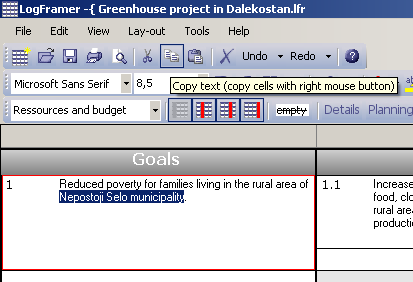
You can cut, copy and paste text within a cell of the logframe, using these buttons in the Main toolbar.
- Click on the cell that contains the text you want to cut or copy. The cell will be marked by the red selection rectangle.
- Click and drag to select the words that you want to cut or copy.
- Click on the Copy button (or press <Ctrl> + <C>), or on the Cut button (or <Ctrl> + <X>)
- Select the spot where you want to paste the text
- Press the Paste button (or <Ctrl> + <V>)
You can select and cut, copy or paste text in the same way in the Details window.
This way, you can also move or copy text between Logframer and other applications such as Microsoft Word™. However, if you want to copy a lot of text from a logical framework that you’ve made in Excel to Logframer, you’re probably better off using the Import function.
Copying and moving cells within the logframe
Using the right mouse button, you can copy or move one or more cells within the logframe.
To move one or more cells:
- Select a cell by left-clicking on it. Alternatively, you can select multiple cells by dragging your mouse while keeping the left mouse button depressed, until all the cells you want to move are marked by the red selection rectangle.
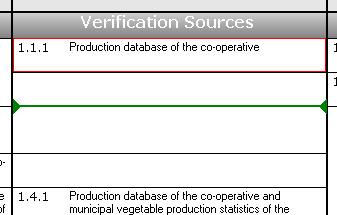
- Right-click anywhere within the red selection rectangle and while keeping the right mouse button depressed, drag towards the place you want to paste the cells. You will see a green indicator line to show you where the cells will be pasted when you release the right mouse button.
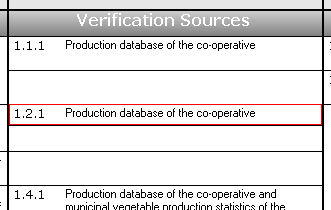
- Release the right mouse button to paste the cells.
To copy one or more cells:
- Follow the same procedure, but keep the <Ctrl> button on your keyboard depressed to copy the cells instead of moving them.
 |
 |
Referential integrity while moving or copying cells
When you’re moving or copying, you’re not just displacing some cells like you would in a spreadsheet. As we’ve explained earlier, the different items in the logical framework are linked to each other. Logframer will manage these relations for you when you copy or move.
For instance, when you copy/move an indicator to another location within the indicator column, Logframer will copy/move its verification sources with it. However, when you move or copy an indicator to another column, Logframer will only move/copy the text of the indicator to that new place. The verification sources will remain where they were, and instead of the old indicator text, you will see ‘{indicator}’ in that cell.
- When you move/copy an item within the same column, for instance an indicator from the first goal to the indicator column of output number three, Logframer will move/copy the item including it’s horizontal children:
- An indicator will be copied with its verification sources
- A goal, purpose, output or activity will be copied with its indicators (and their verification sources), and its assumptions.
- When you move/copy an item from one column to the other, only the text of the item will be moved to the new column. The horizontal dependencies will remain in place and a placeholder text will appear (for instance ‘{indicator}’)
- Vertical dependencies:
- When you move a purpose that has outputs to another section (the goals, the outputs or the activities section), Logframer will leave its outputs and activities in place and display ‘{purpose}’ where its text used to be.
- When you move an output that has activities to another section (the goals, the purposes or the activities section), Logframer will leave its activities in place and display ‘{output}’ where its text used to be.
Changing the order of items in the Details window (moving items)
Note: the following feature is only available in version 1.1 of Logframer
When you create an indicator, you have the possibility to formulate a number of responses or sub-indicators in the Details window. Similarly, you can detail a resource with a number of items and their respective cost.
It is possible that at a later stage you would like to change the order in which these items are appearing. You can do so by using the right mouse button, just like you would in the logical framework. Just press the right mouse button on the item you would like to move, and drag it to the new location. A green indicator line will show you were the item will be inserted when you release the right mouse button.
Copying responses from one indicator to the other
If you want to copy a response from one indicator to another indicator, select the response in question by clicking on the row header:
Next in the Main menu bar, select Edit → Copy response item, or press <Ctrl><Shift><C>.
Then in your logframe, click on the other indicator. Select the detail window again by clicking on any of the responses. Then go back to the Menu bar and click on Edit → Paste response item, or press <Ctrl><Shift><V>. The response will be added to the end of the list of responses of that indicator.
Copying the response structure of one indicator to another
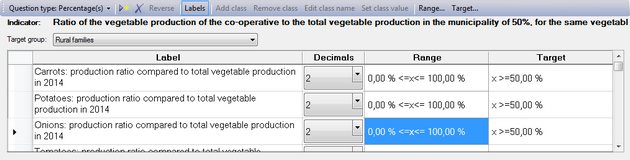
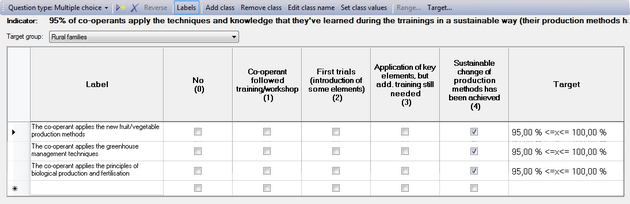
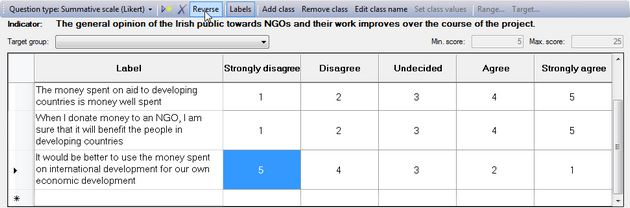
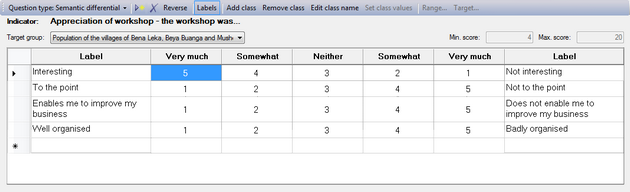
Let's say you've defined an indicator with a complex structure. In the example below, we see a number of sub-indicators. The response structure is that of a multiple choice question, with five columns or classes.
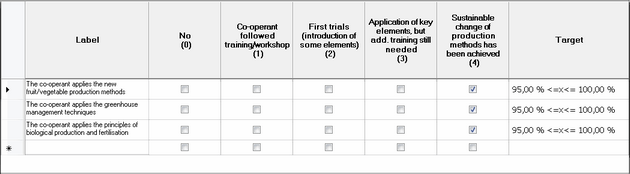
This response structure may be interesting for another indicator, but you may not want to copy the sub-indicators and their targets. So instead of copying the whole indicator with all its responses, in this case you can copy the response structure (the five columns between the Label and Target columns) to another indicator.
Steps:
- Click on the first indicator, that has the response structure you want to copy.
- Go to Edit → Copy structure of responses in the Menu bar, or press <Ctrl><Alt><C>.
- Click on the other indicator
- Go to Edit → Paste structure of responses in the Menu bar, or press <Ctrl><Alt><V>.
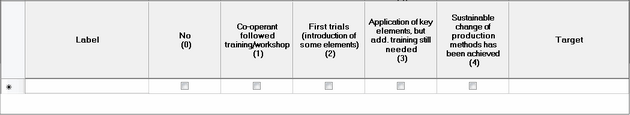
You can see that the response structure has been copied, but none of the actual responses.
Note that this action also changes the question type. If the question type of the second indicator was set to Open ended question before, it will change to multiple choice question after you paste.
Deleting logframe items
To remove an item from your logframe:
- Click on it to select the item
- Press on the Delete button
 to remove it
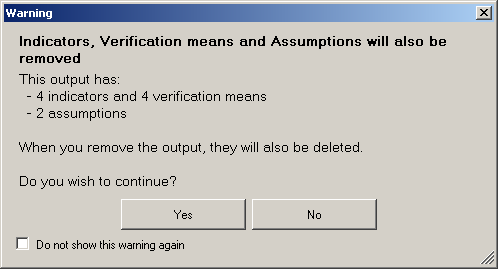
When the item has dependencies, Logframer will show a warning:
Click <Yes> to delete the item anyway. If you want to remove an item without removing its horizontal dependencies, simply click into the cell and clear the text.
The vertical dependencies will not be removed. For instance, when an output has activities, the text of the output will be set to ‘{output}’ and its indicators, verification sources and assumptions will be removed. However, its activities will remain.
Registering additional information in the Details window
Once you’ve designed your basic logical framework in the main window, you can complete it with additional information using the Details window in the bottom half of your screen. If this window is not visible, you can press the button on the Lay-out toolbar.
The content of the Details window changes according to which cell you’ve selected in the main Logframe window:
- When you click on any of the goals in your logframe, you can complete general information about your project, such as its title, its starting date and end date (duration), information about your partners and other parties involved in your project (suppliers, donors, auditors…) and contact information.
- When you click on a purpose, you can identify the target group(s) and indicate the number of people (women, men) involved. You can also design the target group identification form here.
- For each output, you can identify key moments in the project, saying what should be achieved by when.
- For each activity, you can indicate when the activity starts, how long it will take, which other activity or event it will follow, how much time you will need to prepare, how long the follow-up period will be, how many times the activity will be repeated and who will be responsible for the execution.
- For each indicator, you can design how the indicator will be measured, using hard values, open ended questions, multiple-choice questions and so on. You can identify standard answers or limit the range of values that can be used.
- For each verification source, you can identify how the information will be measured, by whom and how regular.
- For each resource you have the choice between entering a global cost in the Budget column, or specifying multiple items in the Details window and calculate their total using their unit costs and if necessary the duration (for instance to calculate monthly wages).
- For each assumption, you can make a risk assessment and identify how you will respond should this risk materialise during the course of your project.
All this information is optional, you don’t have to fill out all these details if you don’t want to. However, if you want to print out additional reports, such as the project’s planning, the target group identification form, the Performance Measurement Framework (PMF) or the Risk Register, you will need to complete (at least a part of) this additional information.
Information about your project and partner organisations
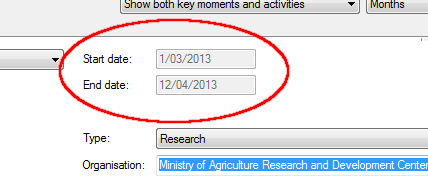
Click on any of your goals to show the Project information window. Here you can enter the title of your project and its duration. You can express the duration in days, weeks, months or years. Logframer will calculate the end date of your project when you change the duration (or modify the duration when you change the end date).
You should fill out the starting date and duration of your project before you start adding key moments to your outputs, or before you add the starting date and duration of your activities.
When you click on the Partners tab, you will see the list of partners (and other organisations that are involved in your project):
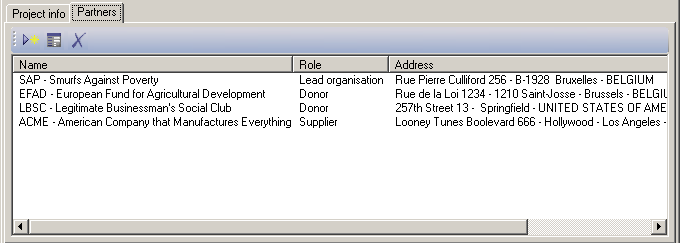
To add a new organisation to the list, click on the New organisation button  to open the following dialog window:
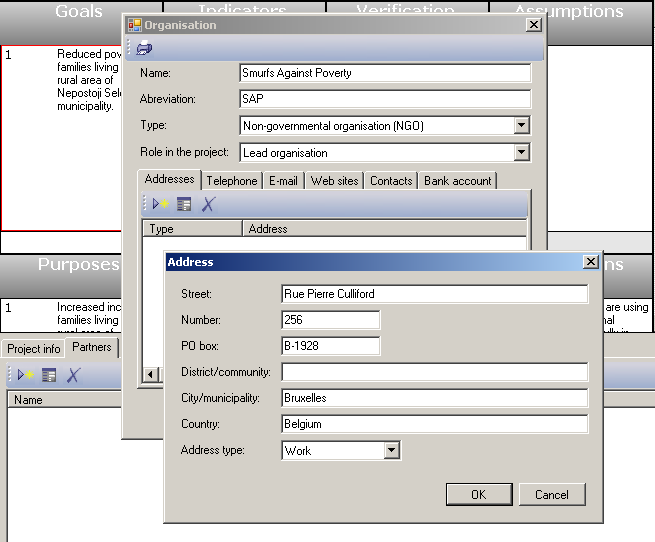
For each organisation, you can enter its name (and abbreviation) and indicate what kind of organisation it is (NGO, company, bank, medical institute…). You can also indicate the role that this organisation will have in your project:
- Lead organisation
- Partner
- Implementing partner
- Donor
- Financial institution (bank)
- Supplier
- Service provider
- Auditor
- Network
- Other
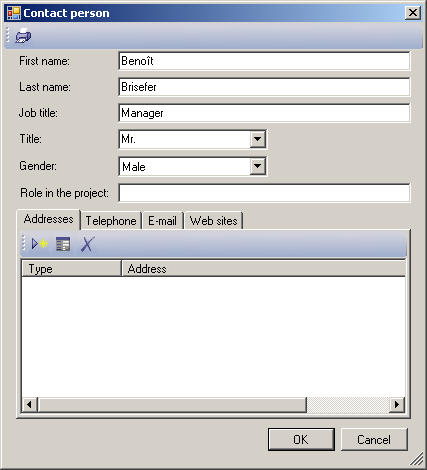
On the different tab pages below, you can register other information, such as the organisations address(es), telephone numbers, e-mail addresses, websites and financial information (bank accounts). Finally, you can also register information about your contact persons, including their addresses, personal telephone numbers and e-mail addresses, and their website address.
Identification of your target groups
Click on a purpose to show the list of Target groups. This list gives you an overview of the target groups and the number of people that are concerned, as well as their location.
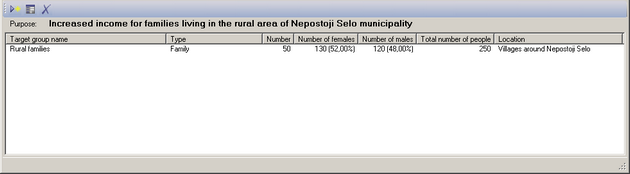
To add a new target group to the list, click on the New target group button to open a dialog window:
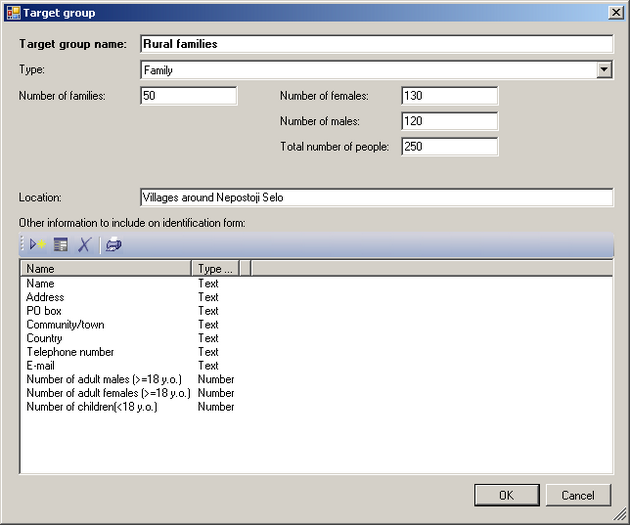
The second field allows you to select the type of target group you’re working with. You can select between the following options:
- Individual
- Family
- Extended family
- Community
- Association
- Enterprise
- Local authority
- Authority
- Other
Depending on the choice you make here, Logframer will add a list of suggested items for the list of information to include on the identification form (the list on the bottom of the dialog window).
You can modify this list by adding or removing fields. When you’re ready, you can push the printer button to get a preview of the Target group identification form, ready to print out. This form then can be used to identify individual people, families, organisations and so on in the field.
Identifying key moments
Click on an output to show its list of key moments. You can identify any number of key moments for each individual output.
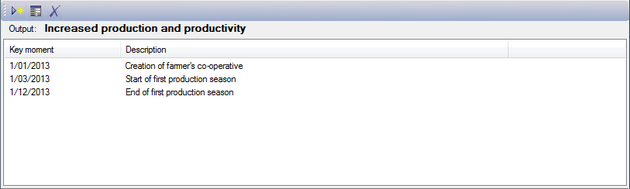
The key moments are sorted by date. If you want to reverse the sort order, you can click on the column header of the first column (or click on the Description header if you want to sort them alphabetically for instance).
To add a new key moment, click on the New key moment button to open a dialog window:
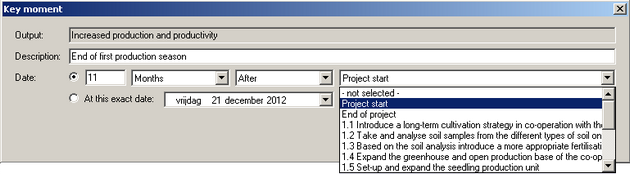
Here you can name the key moment, and set a date. You have two options to set a date:
- Select a date relative to another key moment, such as the start of the project, its ending or one of the activities.
- Select an exact date.
Selecting a date relative to another moment is practical in case you have to change dates in a later stage. For instance, if your project starts six months late, you only have to change the starting date. All dates relative to the starting date (directly or indirectly because they in turn are linked to a date that is related to the starting date) will then change.
In the Planning overview, key moments are indicated by a red diamond (rhombus).
Planning an activity
When you click on an activity, you can view or complete any related planning information.
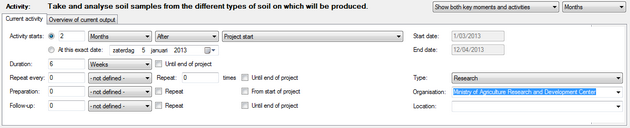
Setting the starting date and the duration of an activity
First you have to determine the starting date of the activity. As with key moments, you have the choice between a date relative to another activity or key moment, or an exact date. The advantage of a relative date is that you can make clear that the first activity has to end before the second one can start (because you need the results of the first activity as an input for the second one). For instance, you want to cultivate new crops. But before you can start planting, you need to analyse the composition of the soil, to make sure your new crops will grow in that particular kind of soil. So the planting can't start before you have the results of the soil analysis. If the analysis takes longer, the planting moves forward in time too. You can achieve this by using relative dates:
- Insert the number of days/weeks/months in the first field.
- Select the time unit. You can choose between minutes, hours, days, weeks, months, trimesters, semesters or years.
- Select whether this activity will start before or after the other activity.
- Select the activity or key moment to which you want to make a reference. You can choose from any key moment or activity that you've defined, as well as the project's start or ending.
Alternatively, you can select any specific date using the date selector on the second line.
Next, you can determine the duration of your activity, in minutes, hours, days, weeks, months, trimesters, semesters or years. If you want the activity to continue until the end of your project, first select the duration unit, and then check the Until end of project box. Logframer will then calculate the number of days/weeks/months... until the end of the project.
Once you've set the starting date and the duration of your activity, you can verify the exact starting and finishing date of your activity to the right.
Repeating an activity
You can repeat an activity any number of times. First, set the interval at which you want to repeat the activity. In the example below, we'll repeat the activity every six weeks.
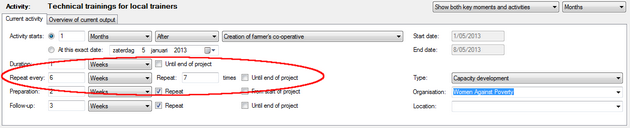
Next, you can determine how many times you want to repeat the activity. If you set the Repeat value to 1, the activity will show up two times in your planning: the original activity and then the one repeat. When you set this value to zero again, the activity will not be repeated.
When you check the Repeat until end of project box, Logframer will calculate the number of times you're activity will be repeated until the end of the project.
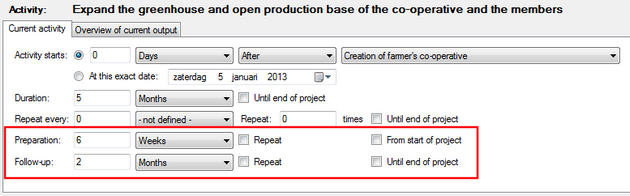
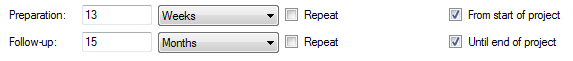
Setting the preparation time and the follow-up period
You can indicate how much time you will need to prepare for your activity using the Preparation field. Below, you can determine how much time you want to dedicate to follow-up your activity.
If you have a repetitive activity, the Repeat check boxes allow you to choose whether you'll only need the preparation or follow-up time for your original activity, or every time you're repeating it.
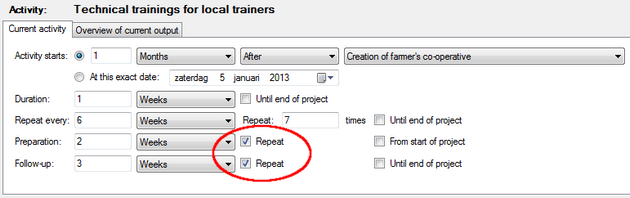
For instance, if you want to do a series of presentations, you may have to prepare a document or Powerpoint presentation once, before the first presentation. The next time, you won't need any time to prepare. However, if you're in charge of the logistics of a series of workshops, you may need a day of preparation time before every workshop, to set up the sound system, arrange the chairs, clean the room, etc. In such a case, you may want to use the Repeat option.
Using the From start of project option, you can indicate that the preparation time will run from the start of your project until the beginning of your activity. Logframer will calculate the number of days/weeks/months... you have until then.
Similarly, you can extend the length of your follow-up period until the end of the project by checking the box to the right.
Other information about the activity
Selecting the type of activity
Using the Type field at the right, you can indicate what kind of activity you're dealing with. You can select from a large number of options, including: Planning, Reporting, Monitoring, Registration of beneficiaries, Procurement, Meetings, Travel, Construction, Research, Distribution, Humanitarian Assistance, Capacity Development, Raising awareness, etc.
Who is responsible for the activity?
The Organisation field allows you to select which partner organisation or contractor will be responsible for the execution of the activity. You can select any organisation from your Partners list.
Where will the activity take place?
Use the Location box to indicate where the activity will take place. You can insert any new place, or select a place where you've previously organised an activity from the drop-down list.
Getting an overview of the activities of the current output
When you have a number of activities, some of which are linked to others and some of which may need preparation time, or follow-up afterwards, or may have to be repeated, it can become difficult to keep track.
When you click on the Overview of current output tab, you will get an overview of all the activities of the current output in the form of a Gantt-chart.
The two drop-down lists at the top right allow you to manipulate the view of this Gantt chart.
- You can choose to see the activities only, or both the activities and the key moments that you have identified for this output.
- You can change the level of detail to days, weeks, months or years.
On the left, you can see the list of key moments (shown first in blue) and activities. On the right, you can see the actual Gantt chart:
- The duration of each activity is shown as a horizontal bar. The activity itself takes up the whole height of the row (thick part). The preparation time and the follow-up period are shown as thinner lines before and after the activity itself.
- Each type of activity has another colour (here purple is related to planning, green is construction, yellow has to do with capacity development)
- The black arrows show which activities are linked to key moments (the red diamonds), or to other activities.
Alternatively, if you want to have an overview of the activities and/or key moments of all the outputs - or in other words the complete planning of your project - you can open the Planning window.
Setting the type of indicator and how it will be measured
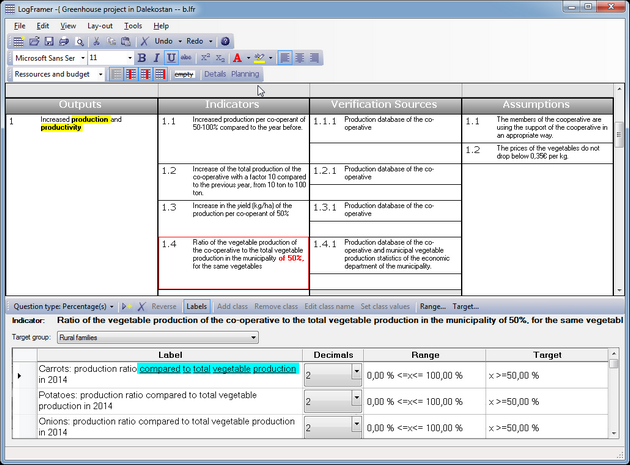
Click on an indicator in the logframe to see the Indicator detail window at the bottom of your screen. The content of this window depends on the type of indicator (the question type). On top you can see the Indicator toolbar, with the text of the indicator repeated in bold underneath. On the next line, you can choose to which target group this indicator applies. Finally on the bottom there is a table where you can design the details of your indicator.
This table at the bottom allows you to work with compound indicators, or indicators that are made up of a series of questions that bring together the information you're looking for. Alternatively, you can also specify different targets for different years - as in the example above.
If you want a simple indicator, you can just fill in the first line of the table.
The Indicator toolbar

Basic functions:
- To change the type of question/indicator, use the
 button in the toolbar.
 - To add a response to the table, you can click on the
 button in the toolbar. Alternatively, you can simply go to the bottom row of the table and enter your text there.
 - To remove a response from the table, click on the button in the toolbar.
- You can show or hide the labels column(s) by clicking the
 button.
 - For certain types of indicators, you can add responses in the form of columns (for instance for a multiple choice question). These options are referred to as classes and there are three buttons to manipulate them:
- The Add class button

- The Edit class button

- The Remove class button

- The Add class button
- When you work with values (or percentages), you can limit the range of values that people can use, using the
 button.
 - For many types of indicators, you can indicate the
 range , either as values or percentages, or else as a part of the population (also in percentages).
Question types
Logframer allows you to choose from a whole range of indicator types:
- The open ended question
- Registration of values or percentages
- Multiple choice questions, multiple options questions
- Yes/no-questions
- Ranking questions
- Best/worst scaling (maximum differential)
- Preferential scales where the respondent has to indicate his preference on a number of options: Thurstone scale, Summative scale (Likert), Cumulative scale (Guttman)
- Semantic differential
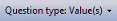
Open-ended questions
The advantage of an open-ended question is that it allows people to express themselves freely, thus providing you with information that you might not have found otherwise. Open-ended questions are also interesting to get information about how a person feels about something. Often, the answers you get are more objective than direct or closed-ended questions.
Typically, open-ended questions start with 'Why...', 'How...', 'How do you feel about...' and so on.
The disadvantage of open-ended questions is that by definition, the replies are not standardised. This means that collecting, treating and analysing the information can be more complex, especially when you interview a lot of people.
In terms of the logical framework, open-ended questions are interesting to measure outcomes (expected or unexpected effects; wanted or unwanted effects) and impact (expected or unexpected; wanted or unwanted).
You can enter one or more questions in the 'Label' column of the table. In the 'White space' column you can set how much space the respondent or the interviewer has to note down the answer. This way you have some measure of control to the length of the answer. The amount of white space can vary from 1 to 7 lines, or from a quarter page to a full page.
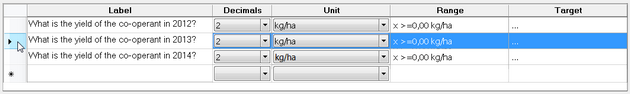
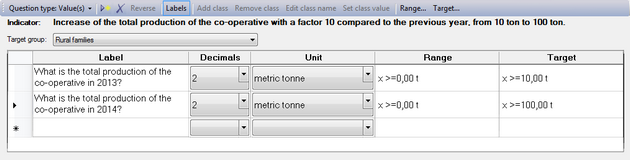
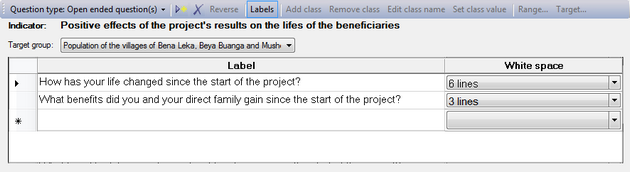
Registration of values or percentages
In many cases, you will want to register hard data in the form of absolute values. Often, Objectively Verifiable Indicators are seen as synonymous to numbers, however this needn't be the case. Also take into account that numeric indicators may look good on paper, but may be very difficult to measure in practice. In many countries, statistics are notoriously hard to get by, and people are far less 'number-oriented' than in highly developed societies, where everything is measured and everything has got a price.
- In the 'Label' column, you can specify your question(s).
- The 'Decimals' column allows you to specify to what degree of exactitude the value has to be measured, i.e. the number of decimals behind the decimal point/comma.
- You can specify the unit of your values using the drop-down list of the Unit column. You can choose from a wide range of metric units, US customary units, time units and others. If you can't find the unit you need, simply type it into the field and it will be added to the list as a user-defined unit.
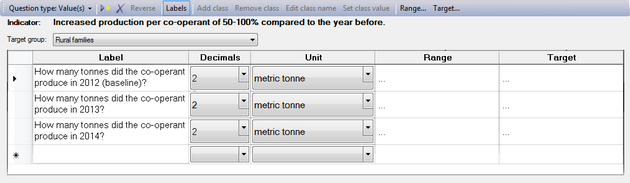
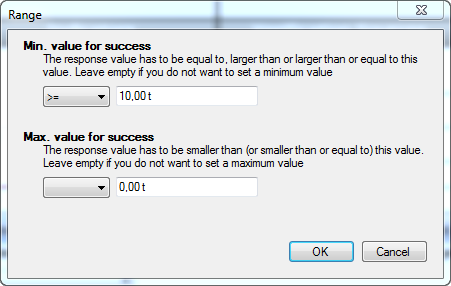
Setting a range
If you want to set a limit to the values that should be registered, you can identify a range. When you click on the button, you will get a pop-up dialog that allows you to set the bottom value and top value of the range. You can also double-click on the cell to open this dialog window.
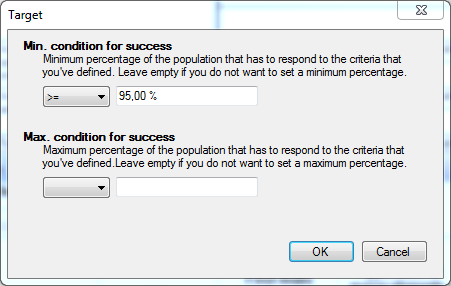
The drop-down list on the left of the value field allows you to specify whether the registered value has to be greater than, greater than or equal to, or equal to the minimum value. For the maximum value, you can set whether the value has to be smaller than, smaller than or equal to, or equal to this value.
You do not need to set both the minimum and maximum value. For instance, if you want to avoid negative values, you can set the minimum value to greater than or equal to zero.
Setting a target
More often than not, you'll have a target to achieve. By clicking on the button, or double-clicking on the target cell in the table, you will get a similar dialog to the one used for setting the range.
Percentage values
If you select 'Percentage' as the question type, you get almost exactly the same window. The difference is that there is no Units column, and that all values are expressed as a percentage.
Multiple choice / multiple options
Multiple choice and multiple options questions allow you to identify a series of standard responses from which your respondent or interviewer/observer can choose from. With multiple choice, you can only select only one of the options. With multiple options, you can select more than one option at a time.
Working with classes
Modifying the class names (column headers)
When you set the Question type to 'Multiple choice', you will get an empty table with three classes, called 'Class 1', 'Class 2' and 'Class 3'. To change these column headers, just click somewhere in the column, and then on the button. You can also double-click on the column header. This will make a text field appear, where you can modify the name of this class (column).
Adding and removing classes
If you want to add a class (column), click in the column to the right of where you want to insert it. For instance in the example above, if you want to add a column between Class 2 and Class 3, you should click in the Class 3 column. Then press the button in the toolbar.
If you want to remove a class (column), click in the column itself and then on the button.
Add questions and indicate the preferential answer
Go to the first row and enter the first question in the 'Label' column. Then you can indicate what would be the correct or preferred answer from your respondents, by clicking in that column. A check mark will appear.
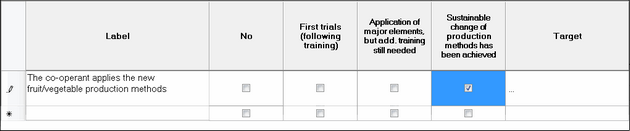
Setting the target of a multiple choice/options question
You can set the target in terms of how many beneficiaries out of the total group (population) will achieve this target. Click on the button, or double-click on the target cell in the table to open the following dialog window:
Setting class values
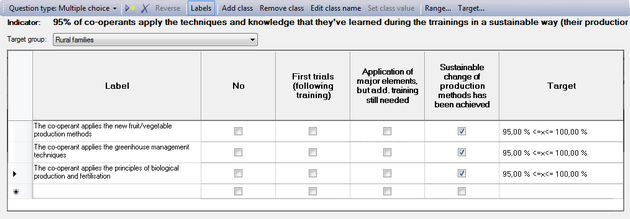
If you want, you can give every class a number to facilitate the registration of results. You can use these values in a different way too, to give points or scores as in the example below: if the co-operant has only introduced some elements of what he/she learned on a training, he/she will get 1 or 2. If she/he rely applies what she/he has learned, then the score will be 3 or 4.
Click on the  button to open the following dialog:
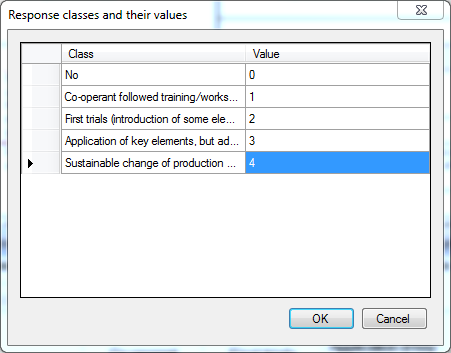
In the first column, you can see the class names (the text that appears in the column headers). In the second column you can enter any value you want.
When you press the < OK > button, you will see these values appear in the column headers between brackets, below the text, as in this example:
Yes/No questions
Some questions can be answered by a simple yes or no. This type of question is easy to use, and a series of yes/no questions can be used to measure more complicated indicators. For each question, you can indicate the correct answer, and you can also set a target in terms of what percentage of the population should get it right.
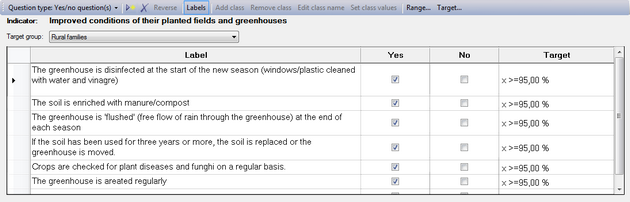
Add questions and indicate the preferential answer
Go to the first row and enter the first question in the 'Label' column. Then you can indicate what would be the correct or preferred answer from your respondents, by clicking in that column. A check mark will appear.
Set the target
You can set the target in terms of how many beneficiaries out of the total group (population) will achieve this target. Click on the button, or double-click on the target cell in the table to open the following dialog window:
Ranking questions
With ranking questions, you present the respondent with a number of options, and ask him or her to indicate which one is the most important, second most important, third most important (and so on).
Working with classes
Modifying the class names (column headers)
When you set the Question type to 'Ranking', you will get an empty table with three classes, called 'Class 1', 'Class 2' and 'Class 3'. To change these column headers, just click somewhere in the column, and then on the button. You can also double-click on the column header. This will make a text field appear, where you can modify the name of this class (column).
Adding and removing classes
If you want to add a class (column), click in the column to the right of where you want to insert it. Then press the button in the toolbar.
If you want to remove a class (column), click in the column itself and then on the button.
Add questions and indicate your preferential ranking
To add questions, go to the first row and enter the questions in the 'Label' column.
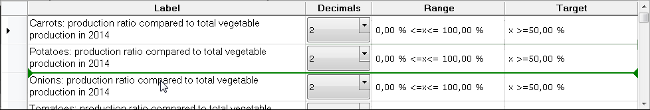
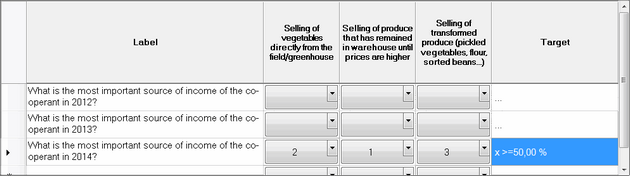
If you want, you can indicate the preferential ranking, meaning the ranking that you hope to achieve by the end of the project (or any other period of time). For instance, in the example below, most people sell their produce immediately when it's harvested. This means that often they don't get a good price, because at harvest time there are a lot of producers offering their vegetables and so on at the same time, so prices are low. It would be better to sell them when there aren't many vegetables around, but that means you have to keep them in a warehouse or freezer. Another option to add value is to transform them into something that has more value (soup or sauce or canned vegetables...)
So when we ask the producers before the project starts what the most important source of income is, they may rank it as follows:
- Selling of vegetables directly from the field/greenhouse
- Selling of transformed produce
- Selling of produce that has remained in the warehouse until prices are higher
What you hope to see in the end is that a certain percentage of producers have changed this order around to:
- Selling of produce that has remained in the warehouse until prices are higher
- Selling of vegetables directly from the field/greenhouse
- Selling of transformed produce
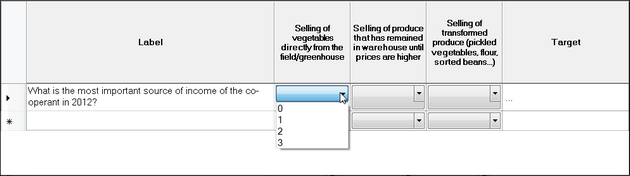
To set the preferential ranking, just click on the drop-down list and select any of the values. You can also click on the cell and type the value. The minimum value is zero, the maximum value is equal to the number of classes (columns).
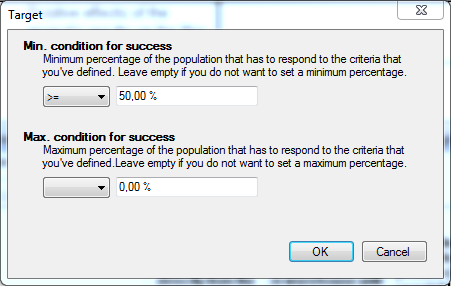
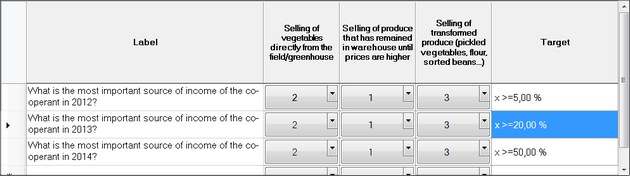
Set the target of a ranking question
You can set the target in terms of how many beneficiaries out of the total group (population) will achieve this target. Click on the button, or double-click on the target cell in the table to open the following dialog window:
You can set out a preferential ranking that you would like to achieve by the end of the project, and indicate per year how your beneficiaries will evolve towards that target, as in the example below:
Best/worst scaling or MaxDiff scales
When you use best/worst scaling or MaxDiff scaling (Maximum differential), you present the respondent with a number of options. Then you ask him or her to indicate which one in his/her opinion is the most important (or the best), and which on is the least important (or the worst).
Compared to other rating scales, best/worst scaling pushes people to make a clear-cut choice between a number of options. Instead of asking people to choose the best out of one pair and then move on to the next pair and the next until you've got a definite choice, this kind of scaling allows the respondents to choose directly from a whole set, which makes it easier to use and to take a decision. Another benefit from MaxDiff scaling is that there are no numbers involved, people just have to indicate the best and the worst choice in their opinions.
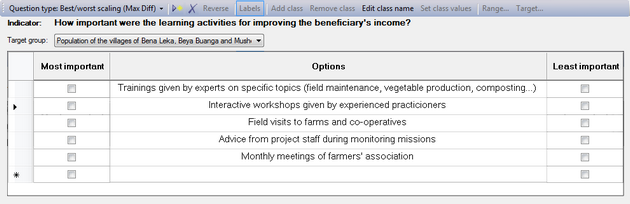
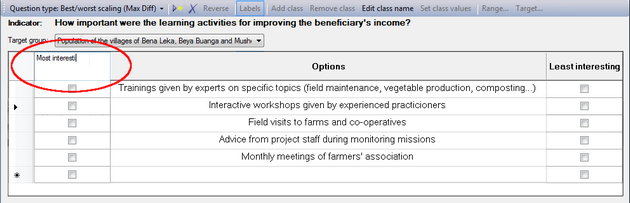
Modifying the class names (column headers)
When you set the Question type to 'Best/worst scaling (MaxDiff)', you will get an empty table with an Options column in the middle, with a check box column on either side. By default, Logframer will indicate the column on the left 'Most important' and the one on the right with 'Least important'.
You can change the headers of these columns any way you want. To do this, click somewhere in the column, and then on the button. You can also double-click on the column header itself. This will make a text field appear, where you can modify the header of this column.
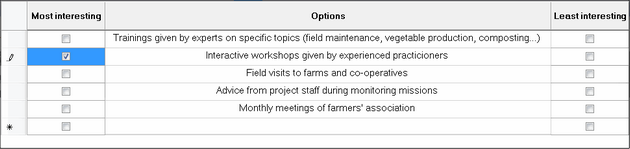
Add questions and indicate your preferential ranking
To add questions, click in an empty cell in the 'Options' column in the middle and enter your text.
If you want, you can also indicate the preferential ranking, for one or both selection columns, to indicate the ranking that you hope to achieve by the end of the project (or any other period of time).
Thurstone scale (method of equal-appearing intervals)
The method of equal-appearing intervals or the Thurstone scale is used to measure attitudes of people. Logframer allows you to use a Thurstone scale to measure an indicator, but developing such a scale is not so simple.
This kind of scale is used to measure people's attitude towards a fairly clear and unidimensional concept, using a number of statements that vary in how they express a positive or negative opinion about the main concept. We'll briefly explain the steps of developing a Thurstone scale:
- Determine the focus: what concept are you going to measure (see what people's attitudes are toward it)?
- Ask a group of people (or a person) to write down different statements about this concept, reflecting different opinions or attitudes about the subject. Make sure you have a large number of statements, making sure that people can either degree or disagree with them (no - open - questions for instance).
- Rating the scale items: the next step is to have your group rate each statement on a 1-to-11 scale in terms of how much each statement indicates a favourable attitude towards the concept. The members of the group must not express their own opinion, they must only indicate how favourable they feel each statement is. You can use a scale with 1 = extremely favourable attitude towards the subject (focus) and 11 = extremely unfavourable attitude towards the subject.
- Compute the median and interquartile range for each statement. Create a table with these values and sort by the median.
- Select the items for the actual scale: you should select statements that are at equal intervals across the range of medians. Within each value, you should try to select the statement that has the smallest Interquartile Range. This is the statement with the least amount of variability across judges. You don't want the statistical analysis to be the only deciding factor here. Look over the candidate statements at each level and select the statement that makes the most sense. If you find that the best statistical choice is a confusing statement, select the next best choice.
For a detailed example, see http://www.socialresearchmethods.net/kb/scalthur.php
You can now use the scale to measure attitudes 'in the field': enter the list of statements and use them to interview people or present them in a document. For each item, they should express whether they agree or disagree. The total score of a person is calculated by making the sum of the values of all the statements they agreed with, divided by the number of items he agreed on (in other words, the average of the statements they agreed with).
Modifying the class names (column headers)
When you set the Question type to 'Scale (Thurstone)', you will get an empty table with the usual 'Labels' column, and two classes: 'Agree' and 'Disagree'. You can change the headers of these columns any way you want, but make sure that the second column remains the favourable option and the last column the unfavourable option.
To change the column headers, click somewhere in the column, and then on the button. You can also double-click on the column header itself. This will make a text field appear, where you can modify the header of this column.
Add statements
To add the statements that make up your scale, go to the first row and enter them in the 'Label' column.
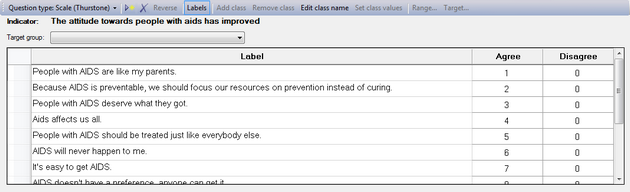
Every time you add a statement, you will see a value appear in the 'Agree' column (second column). The first statement will get 1, the second 2 and so on. In other words, Logframer assumes that the first statement is the first one on your scale and so on. But if you want to randomize your statements and use different values than the ones that are generated automatically you can do so.
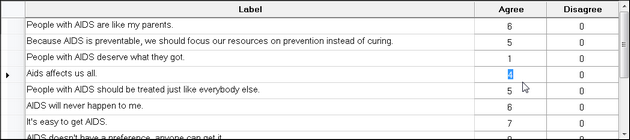
Modifying the values of the favourable answers ('Agree' column)
If you want to change the values that are automatically inserted when you add a new statement, just click on the cell and type another value of your scale. You can only modify the 'Agree' column, not the 'Disagree' column.
Likert scale (summative scale)
The Likert scale can also be used to measure attitudes of people. When responding to a Likert questionnaire item, respondents specify their level of agreement or disagreement on a symmetric agree-disagree scale for a series of statements. Thus, the range captures the intensity of their feelings for a given item. As with the Thurstone scale, the development of a Likert scale takes some effort.
A Likert scale uses a number of Likert items, which are statements to which a respondent expresses his agreement or disagreement. Generally, a five-point or seven-point scale is used, for instance:
|
Strongly agree |
Agree |
Neutral |
Disagree |
Strongly disagree |
As you can see, each item is bipolar: it measures either someone's agreement or disagreement to the statement and allows you to give some measure of how much you agree or disagree. There are a variety possible response scales (1-to-7, 1-to-9, 0-to-4). All of these odd-numbered scales have a middle value is often labelled Neutral or Undecided. It is also possible to use a forced-choice response scale with an even number of responses and no middle neutral or undecided choice. In this situation, the respondent is forced to decide whether they lean more towards the agree or disagree end of the scale for each item.
The basic steps of developing a Likert scale are:
- Determine the focus: what concept are you going to measure (see what people's attitudes are toward it)?
- Ask a group of people (or a person) to write down different statements about this concept, reflecting different opinions or attitudes about the subject. Make sure you have a large number of statements, making sure that people can express their degree of agreement or disagreement on a five or seven-point scale.
- Rating the scale items: the next step is to have your group rate each statement on your five-point (or seven-point, or 10-point) scale in terms of how much each statement indicates a favourable or unfavourable attitude towards the concept. The members of the group must not express their own opinion, they must only indicate how favourable or unfavourable they feel each statement is. All statements (Likert items) in the Likert scale must use the same number of points on the scale (so either a 5-point scale, or a 7-point scale, but not a mix of the two).
- Select the items for the actual scale: The next step is to compute the intercorrelations between all pairs of items, based on the ratings of the judges. In making judgements about which items to retain for the final scale there are several analyses you can:
- Throw out any items that have a low correlation with the total (summed) score across all items
- For each item, get the average rating for the top quarter of judges and the bottom quarter. Then, do a t-test of the differences between the mean value for the item for the top and bottom quarter judges.
Correlation between the items and the total score: In most statistics packages it is relatively easy to compute this type of Item-Total correlation. First, you create a new variable which is the sum of all of the individual items for each respondent. Then, you include this variable in the correlation matrix computation (if you include it as the last variable in the list, the resulting Item-Total correlations will all be the last line of the correlation matrix and will be easy to spot). How low should the correlation be for you to throw out the item? There is no fixed rule here -- you might eliminate all items with a correlation with the total score less that .6, for example.
T-test: Higher t-values mean that there is a greater difference between the highest and lowest judges. In more practical terms, items with higher t-values are better discriminators, so you want to keep these items. In the end, you will have to use your judgement about which items are most sensibly retained. You want a relatively small number of items on your final scale (e.g., 10-15) and you want them to have high Item-Total correlations and high discrimination (e.g., high t-values).
For a detailed example, see http://www.socialresearchmethods.net/kb/scallik.php
You can now use the scale to measure attitudes 'in the field': enter the list of statements and use them to interview people or present them in a document. For each item, they should express to what degree they agree or disagree. The final score for the respondent on the scale is the sum of their ratings for all of the items (this is why this is sometimes called a summative scale). On some scales, you will have items that are reversed in meaning from the overall direction of the scale. These are called reversal items. You will need to reverse the response value for each of these items before summing for the total. That is, if the respondent gave a 1, you make it a 5; if they gave a 2 you make it a 4; 3 = 3; 4 = 2; and, 5 = 1.
Working with classes
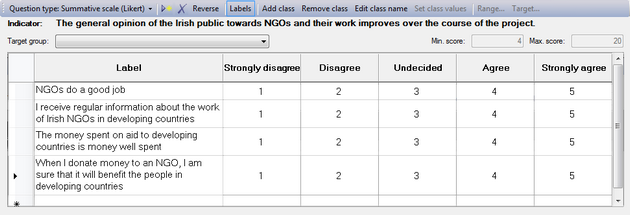
Modifying the class names (column headers)
When you set the Question type to 'Summative scale (Likert)', you will get an empty table with the 'Labels' column on the left, and by default five classes:

To change the column headers, click somewhere in the column, and then on the button. You can also double-click on the column header itself. This will make a text field appear, where you can modify the header of this column.
Adding and removing classes
If you want to add a class (column), click in the column to the right of where you want to insert it. Then press the button in the toolbar.
If you want to remove a class (column), click in the column itself and then on the button.
Add statements
To add the statements that make up your scale, go to the first row and enter them in the 'Label' column.
Reversing the scores/values
Logframer will number the cells of the scale from 1 to the number of columns/classes. For instance, when you have a five-item scale, the cells will be numbered from 1 to 5. You can use these numbers to count how many people have made a particular choice. Or you can use the values as scores, and calculate how well your project has done in comparison to a situation where all the beneficiaries have the maximum or minimum score (depending on whether the preferential choice is 1 or 5). The maximum and minimum scores are indicated on the right, above the table.
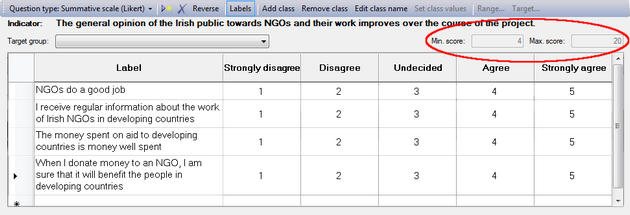
If you want to reverse the order of these scores, you can click on the  button. Instead of 1-2-3-4-5, you will get 5-4-3-2-1.
Modifying the values of the favourable answers
If you want to change the values that are automatically inserted when you add a new statement, just click on the cell and type any other value for your scale.
Cumulative scale (Guttman scale)
The cumulative scale or Guttman scale measures to what degree a person has a positive or negative attitude to something. It makes use of a series of statements that are growing or descending in how positive or negative a person is towards the subject. If for instance on a scale with seven statements the respondent agrees with the fifth statement, it implies that he or she also agrees with the first four statements, but not with statement number six and seven.
To create a Guttman scale, you need to:
- Determine the focus: what concept are you going to measure (see what people's attitudes are toward it)?
- Ask a group of people (or a person) to write down different statements about this concept, reflecting different opinions or attitudes about the subject. Make sure you have a large number of statements, making sure that people can either degree or disagree with them (no - open - questions for instance).
- Rating the scale items: the next step is to have your judges rate each statement, indicating whether the statement expresses a positive (favourable) or negative (unfavourable) attitude towards the concept. The members of the group must not express their own opinion about the concept, they must only indicate whether the statement is favourable or unfavourable.
- Developing the scale: construct a matrix or table that shows the responses of all the respondents on all of the items. Then sort this matrix so that respondents who agree with more statements are listed at the top and those agreeing with fewer are at the bottom. For respondents with the same number of agreements, sort the statements from left to right from those that most agreed to those that fewest agreed to.
- If there are lots of items, you need to use a data analysis called scalogram analysis to determine the subsets of items from our pool that best approximate the cumulative property. Then review these items and select the final scale elements. There are several statistical techniques for examining the table to find a cumulative scale.
- Because there is seldom a perfectly cumulative scale you usually have to test how good it is. These statistics also estimate a scale score value for each item. This scale score is used in the final calculation of a respondent's score.
For a detailed example, see http://www.socialresearchmethods.net/kb/scalgutt.php
You can now use the scale to measure attitudes 'in the field': enter the list of statements and use them to interview people or present them in a document. For each item, they should express whether they agree or disagree. Each scale item has a scale value associated with it (obtained from the scalogram analysis). To compute a respondent's scale score we simply sum the scale values of every item they agree with.
Modifying the class names (column headers)
When you set the Question type to 'Cumulative scale (Guttman)', you will get an empty table with the usual 'Labels' column, and two classes: 'Agree' and 'Disagree'. You can change the headers of these columns any way you want, but make sure that the second column remains the favourable option and the last column the unfavourable option.
To change the column headers, click somewhere in the column, and then on the button. You can also double-click on the column header itself. This will make a text field appear, where you can modify the header of this column.
Add statements
To add the statements that make up your scale, go to the first row and enter them in the 'Label' column.
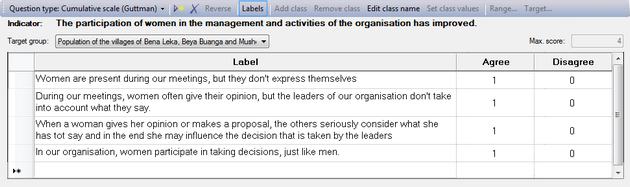
Every time you add a statement, you will see a '1' appear in the 'Agree' column (second column). If you want, you can modify this score but you can only modify the value in the 'Agree' column and not in the 'Disagree' column.
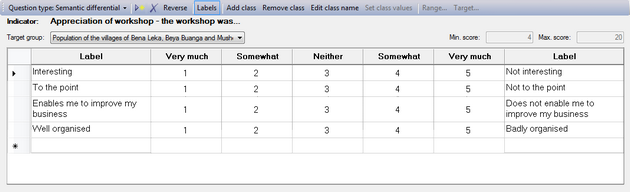
Semantic differential
A semantic differential is useful to measure what the attitude is of the respondent towards something. In a semantic differential, you have two opposing characteristics at either end of a scale (also called a bipolar pair). This scale in the middle typically has five or seven items. When the number of items on the scale is uneven, the middle one expresses a neutral point between the two extremes. But this is not necessarily so, you can also have a scale with an even number of items - sometimes up to ten items are used in the scale.
Working with classes
Modifying the class names (column headers)
When you select 'Semantic differential' as the Question type, you will get an empty table with two label columns at either end, and a five-item scale in the middle:
|
Very much |
Somewhat |
Neither |
Somewhat |
Very much |
To change these column headers, just click somewhere in the column, and then on the button. You can also double-click on the column header. This will make a text field appear, where you can modify the name of this class (column).
Adding and removing classes
If you want to add a class (column), click in the column to the right of where you want to insert it. Then press the button in the toolbar.
If you want to remove a class (column), click in the column itself and then on the button.
Adding pairs and changing scores
Adding bipolar pairs
To add questions, go to the first row and enter the pairs in the 'Label' columns at the left and right of the table. The easiest way to come up with a bipolar pair is to write a word or concept in the first column, and to copy it in the last column and put 'not' in front.
Reversing the scores/values
Logframer will number the cells of the scale from 1 to the number of columns/classes. For instance, when you have a five-item scale, the cells will be numbered from 1 to 5. You can use these numbers to count how many people have chosen a particular column. Or you can use the values as scores, and calculate how well your project has done in comparison to a situation where all the beneficiaries have the maximum or minimum score (depending on whether the preferential choice is 1 or 5). The maximum and minimum scores are indicated on the right, above the table.
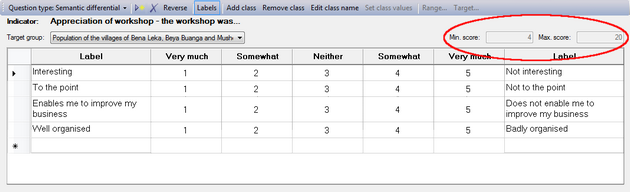
If you want to reverse the order of these scores, you can click on the button. Instead of 1-2-3-4-5, you will get 5-4-3-2-1.
How can the information be verified?
Click on an item in the Verification sources column to get the window shown below:
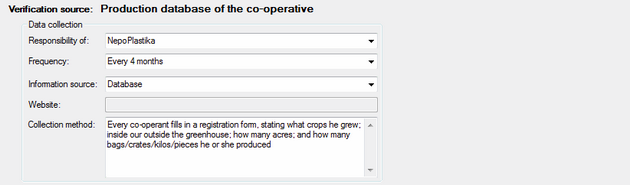
Here you can indicate how the data will be collected, and who will be responsible for the collection of this information.
- To indicate who is responsible for the data collection, you can select any of your partners from the drop-down list.
- Next, you can indicate the frequency at which the data collection should happen: weekly, monthly, every 3-4-6 months, yearly, at the start or at the end of the project, mid-term, before the project starts (ex ante) or after the project (ex post).
- In the third text box, you can indicate what kind of information source you're using: a baseline study, registration forms, follow-up missions, meetings, etc.
- If you've selected a website as your information source in the previous box, you can enter the site's URL in the Website box.
- Finally, you can provide a bit more information about the collection method.
Assumptions: assessing the risk and formulating a response
When you click on an assumption in the logframe window, you can provide information about the kind of risk you may have to deal with, its likelihood and potential impact, and how you will deal with that risk should it occur. On the left side of the details window you can indicate how important you think that risk is. On the right side, you can explain what your approach is to dealing with this risk.
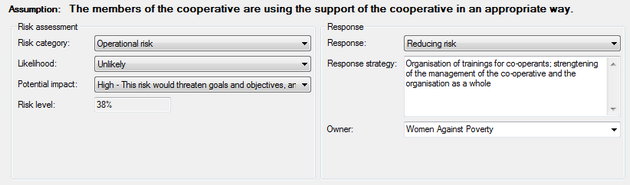
Risk assessment
First you can indicate what kind of risk this is: an operational risk; a financial risk; a risk for your objectives; a risk for your reputation; or another kind of risk.
Then you can indicate how serious you think this risk is, using two parameters. First, you assess how likely it is that this risk will occur in the course of your project. You can select one of four degrees of likelihood by clicking on the drop-down list:
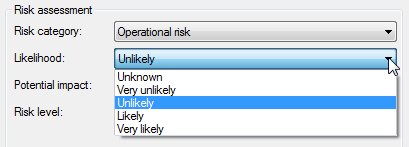
Then you indicate what the impact would be should this risk occur:
- The impact is unknown
- The impact would be very low: routine procedures would be sufficient to deal with the consequences should this risk occur
- The impact would be low: this risk could threaten goals and objectives, and thus may require constant monitoring
- The impact would be high: if it occurs, this risk would threaten the achievement of goals and objectives, and thus may require review of the entire project
- The impact would be very high: when this risk occurs, it would prevent achievement of goals and objectives.
Once you've indicated the likelihood and the potential impact of the risk, Logframer will calculate the Risk level percentage.
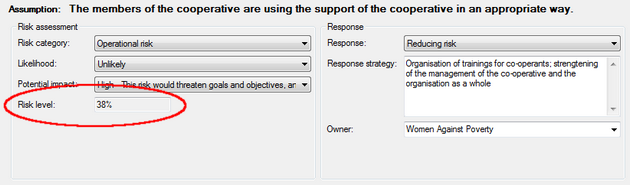
Risk response
At the right side of the window, you can indicate how you will react should the risk eventually occur:
- Trying to avoid the risk altogether
- Trying to reduce the risk or its effects should it occur
- Sharing the risk with others
- Transferring the risk to others
- Accepting the risk
Below the response, you can write down what exactly will be your approach or response strategy once the risk occurs. Finally, you can also indicate which of the partners is ultimately responsible for dealing with the risk.
Detailing budget items
To specify how much a certain resource will cost, you can enter a single value in the Budget column of the logframe window. Alternatively, you can specify any number of items in the Details window. Logframer will calculate the total cost of these different items, and show this total amount in the Budget column.
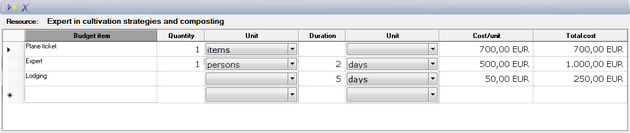
For each item you can specify:
- The quantity
- The duration, if necessary
- The cost per unit
You needn't fill out all three fields if you don't want to. You can either:
- Specify the unit cost only (for instance if you want to indicate a lump sum).
- Specify the quantity and the unit cost
- Specify the duration and the unit cost (for instance to calculate salaries).
- Specify the quantity, the duration and the unit cost.
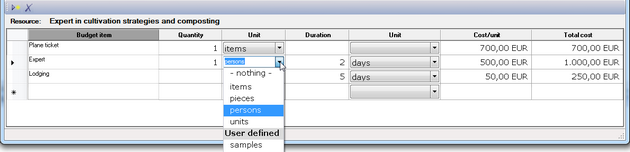
If you want to specify the number unit, you can select a standard item from the drop-down list. Alternatively, you can enter any indication in the Unit column. The text you entered will be added to the bottom of the drop-down list, in the User-defined section.
All prices/costs are shown in a standard currency (in this example in Euros). If you want to change the default currency for your logframe, go to Tools → Options in the Menu bar and select a currency from the drop-down list of the Currency (budget) field.
Undo and Redo

If you want to undo one or more actions, you can use the undo and redo buttons in the General toolbar. If you click on the downward arrow next to Undo or Redo, you will see the list of actions that you can undo or redo:
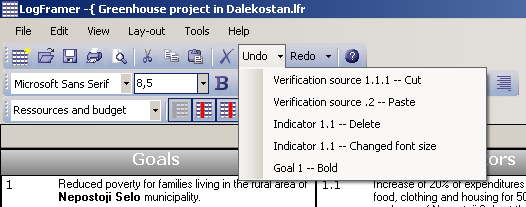
You can undo multiple actions by selecting an item from the list. All the previous actions (above this action) will be undone (or redone).
For each action in the list, Logframer will identify the item that has been changed, moved, copied or deleted, and what change exactly has been made.
Instead of using the <Undo> and <Redo> buttons, you can also select Edit → Undo or Edit → Redo in the Main menu to undo/redo the last action.
Find and replace
In Logframer you can:
- Find and replace text in any part of the Logframe, as well as the various Details windows (project information, target group information, indicators, resources, assumptions, etc.)
- Search for a person or an organisation or any related contact information
Find and replace text
Note: the following feature is only available in version 1.1 (or later) of Logframer
To find or replace text in your logical framework or any of the Details windows, you can use the Find & Replace dialog. To open the dialog, go to the main menu and select Tools → Find... or Tools → Replace...
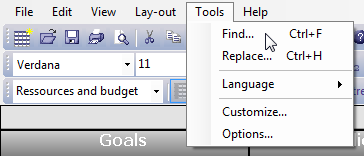
Alternatively, you can press <Ctrl> <F> simultaneously to open the Find dialog, or <Ctrl> <H> to open the Replace dialog.
Find text
Note: the following feature is only available in version 1.1 of Logframer
Go to Tools → Find... in the main menu, or press <Ctrl> <F> to open the Find dialog.
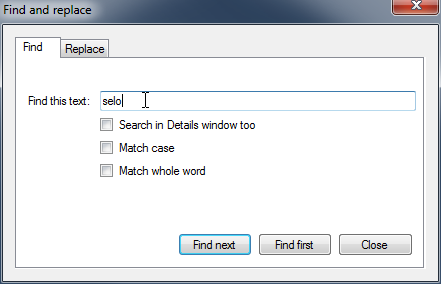
Enter the text you want to find in the text box and press the <Find next> button to find next occurence of your text in the logical framework. Logframer starts to search from the currently selected cell onwards. If you want to start searching from the beginning of the logframe, press the <Find first> button.
When Logframer has found the text, it will be highlighted in its cell.
Logframer will search for any occurrence of the word, regardless of the case (capitals or not) or whether the word you're looking for is part of another word. If you want to find exactly the same case, select the Match case option below the text box. If you want to find it as a separate word only, select the third option.
If Logframer can't find any more occurrences of your text, you will see 'Reached the bottom of the logframe' appear.
Searching in the Details windows
By default, Logframer only searches to logical framework itself. If you want to search for text in the various Details windows, you have to select the Search in Details window too option.
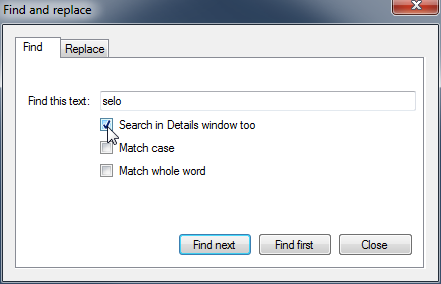
When you select this option, Logframer will look in the project information, target groups, key moments, activities details, indicator details, budget details and so on. Note that this may take a bit more time.
When Logframer has found the text, it will be highlighted in its cell, or in the Details window.
Replace text
Note: the following feature is only available in version 1.1 of Logframer
Go to Tools → Replace... in the main menu, or press <Ctrl> <H> to open the Replace dialog.
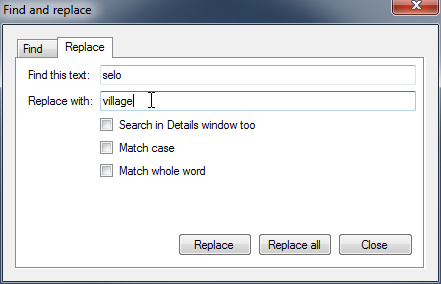
Enter the text you want to find in the first text box and the replacement text in the second text box. Press the <Replace> button to find and replace the next occurrence of your text in the logical framework. Logframer starts to search from the currently selected cell onwards. When Logframer has found the text, it will be highlighted in its cell.
To replace all occurrences of your search text in the logical framework, press the <Replace all> button.
Logframer will search for any occurrence of the word, regardless of the case (capitals or not) or whether the word you're looking for is part of another word. If you want to find exactly the same case, select the Match case option below the text box. If you want to find it as a seperate word only, select the third option.
If Logframer can't find any more occurrences of your text, you will see the text 'Reached the bottom of the logframe' appear.
Replacing text in the Details windows
By default, Logframer only searches to logical framework itself. If you want to search for text in the various Details windows, you have to select the Search in Details window too option.
When you select this option, Logframer will search and replace your search text in the project information, target groups, key moments, activities details, indicator details, budget details and so on, as well as in the logical framework. Note that this may take a bit more time.
When Logframer has found the text, it will be highlighted in its cell, or in the Details window.
You can replace any occurrences of the search text in both the logframe and the details windows by pressing the <Replace all> button.
Find a contact or an organisation
Note: the following feature is only available in version 1.2 (or later) of Logframer
To find a person or an organisation, you can use the Find contact dialog. In the main menu bar, click on Tools and then on Find contact... The following dialog will open:
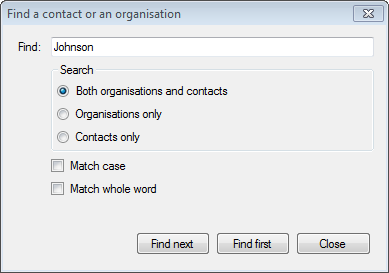
Enter the name of the person or organisation that you want to find. Logframer will search your list of partners and all related information, including addresses, phone numbers, e-mail addresses and so on. This means you can look for more than just names of people or organisations. You can also look for a phone number or find all the people and organisations in a certain city or country for instance.
Use the 'Find next' button to go from one contact to the other. If you want to return to the first record, click the 'Find first' button.
Use the options below to detail your search. If you search both organisations and contacts, the search action will take longer. So you may want to specify if Logframer has to search an organisation or a person. On the bottom you can indicate whether you want to match the case or the whole word.
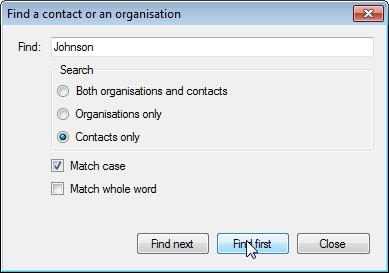
Printing reports

Using the Print and Print preview buttons in the General toolbar, you can print or preview:
- The logical framework
- The list of indicators
- The Performance Measurement Framework (PMF)
- The resources table
- The Risk Register (RR)
- Your project’s planning
- The list of partners
- The target group identification form
To print one of these reports, simply click into the related area. For instance, if you want to print your logical framework, you click on one of the cells, and then on the Print or Print preview button.
For the other reports, you must make sure that the Details section is visible by clicking on the button in the Lay-out toolbar. Then click in the Detail window in the bottom of your screen and finally on the Print or Print preview button.
Alternatively, you can use the Main menu, by clicking on File → Print… or File → Print preview…
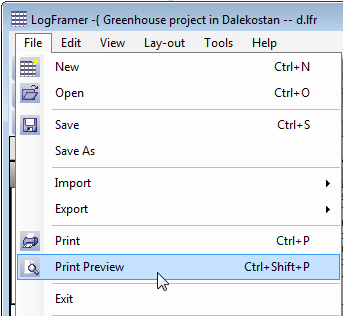
The following pages describe printing in version 1.2 and higher. For information on printing in Logframer versions 1.0 and 1.1, you can follow this link.
The Reports Print Preview window
Note: the following feature is only available in version 1.2 (or later) of Logframer
To open the Reports Print Preview window, click on the  button in the General toolbar. Alternatively, you can use the Main menu, by clicking on File → Print preview…
Using the various tab pages of this window, you can get a print preview of the following reports:
- Your logical framework;
- The list of indicators
- The Performance Measurement Framework (PMF)
- The resources table
- The Risk Register (RR)
- Your project’s planning
- The list of partners
- The target group identification form
To get the report you want directly when you open the print preview window, simply click into its related area. For instance, if you want to print your logical framework, you click on one of the cells, and then on the button. For other reports, you must make sure that the Details section is visible by clicking on the button in the Lay-out toolbar. Then click in the Detail window in the bottom of your screen and finally on the Print preview button.

On the left side, you can see the Print Settings Bar. On the right you can find the actual print preview of the report that you selected. Use the Navigation bar above the print preview to view the different pages, either by using the arrows or entering the number of the page you want to see in the text area.
Use the zoom option to get a closer look at the page, or to see two pages at once. If you click on the magnifying glass, the document will be scaled to actual size (100%). When you click the magnifying glass again, you will get a view of the complete page again. If you press on the down arrow next to the magnifying glass, you will get a list of zoom options:
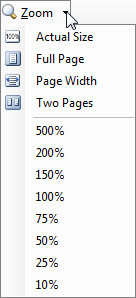
When you open the Reports Print Preview window, or change any of the print options, it can take a while before the report is completed. In that case, you will see a progress bar in the left bottom corner:
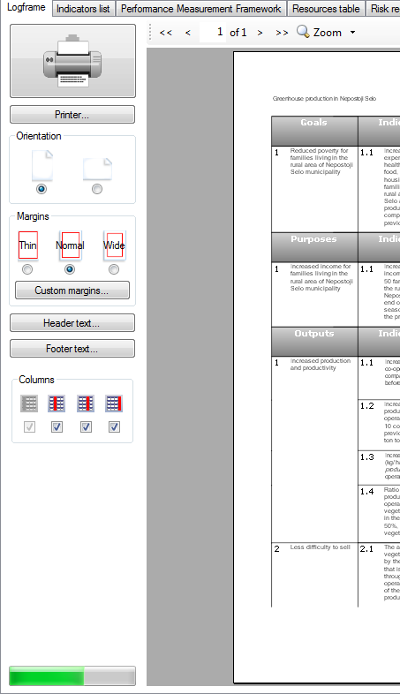
The following pages describe printing in version 1.2 and higher. For information on printing in Logframer versions 1.0 and 1.1, you can follow this link.
Print and page settings of reports
For each report, you can set its page settings including the orientation of the page, the page margins and its header and footer, using the Print Settings Bar on the left side of the Reports Print Preview window.
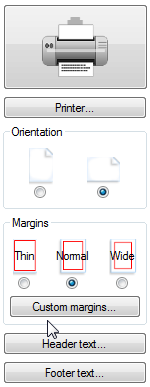 On top of the Print Settings Bar you will immediately spot the big Print button. Press it, and the selected report will roll out of your printer. Underneath the Print button, you can change a number of settings:
- Printer settings: Use the Printer... button to select the printer you want or change printer specific settings (like what paper you want to print on). You can also set how many copies of the document you want, if you want to print recto/verso, in colour or black & white, etc. (provided your printer supports these settings of course). If you want to create a PDF document of your report, you can also install a PDF writer and 'print' to a PDF document.
- Orientation: choose whether you want to have your report in portrait or in landscape mode. Logframer will adapt the spacing of columns automatically, but you may find that the available space becomes too cramped in portrait mode. So for many reports, you may want to switch to landscape mode instead.
- Margins: you can set the margins to thin, normal or wide. Press the Custom margins... button to open a dialog window where you can set the margins manually.
- Header text: click this button to open a new dialog window to set the header text. You can specify a different page header for each individual report, or copy the header of one report to all the other ones. See this page for more information on how to set the header text of your report(s).
- Footer text: click this button to open a new window to set the footer text. You can specify a different page footer for each individual report, or copy the footer of one report to all the other ones. See this page for more information on how to set the header text of your report(s).
You will find these print and page settings options for each individual report. Underneath these basic options you will see report specific options that enable you to change the appearance of that particular report. We will show and explain these options on the corresponding help pages.
Note: for users of Logframer versions 1.0 and 1.1, the Print Settings Bar replaces the Page set-up window.
Headers and footers
For each report, you can set page headers and footers. To do so, press the Headers... or Footers... button in the Print Settings Bar.
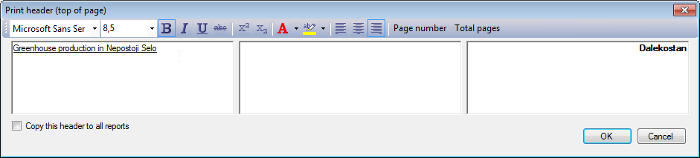
There are three text areas: on the left, the centre and on the right side of the page. If you use all three areas, Logframer will divide the available space between the three areas. If you use only the left and right area, both will get half of the page at their disposal. If you use only one area, it will have the whole page width at its disposal.
You can use all text options that are also available for the logical framework itself (bold, italics, text colour...)
Page numbers
To insert page numbers and/or the total number of pages, you can use the buttons on the right of the toolbar. Simply click with the text cursor on the place where you want to insert the page number, and then click on the Page number button.
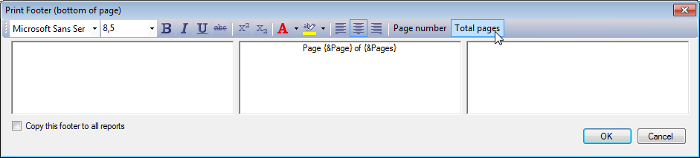
A placeholder text will appear {&Page} that will be replaced by the actual page number in the preview or printed document. You can format this placeholder like you would any other text.
Copy the header/footer to all other reports
If you want the exact same header or footer on all your documents, you can check the Copy this header to all reports option (or Copy this footer to all reports option) on the bottom left of the dialog. When you press the OK button, all other reports get the same outlook.
Logframe print preview
If you select the Logframe tab of the Reports print preview window or you've selected one of the cells of the logical framework before opening this window, you will get the following preview:
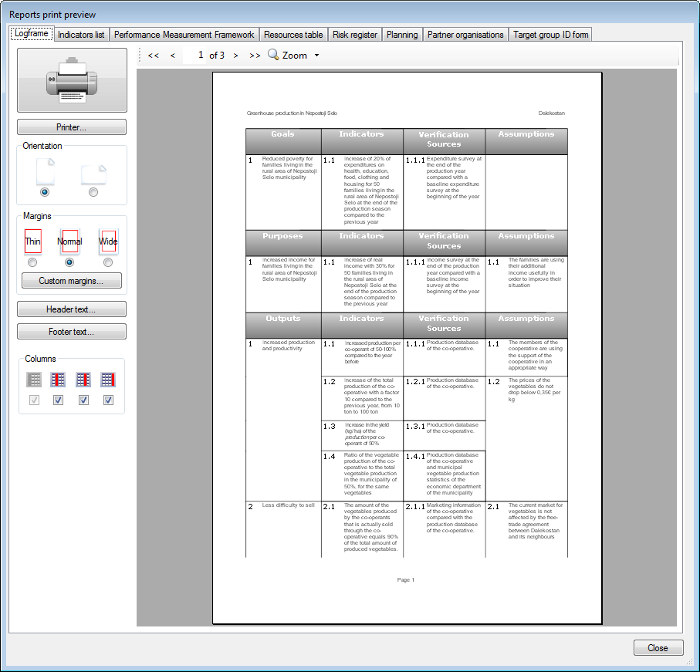
Underneath the usual settings of the Print Settings Bar, you can choose which columns you want to include in your document. This way, you can create different versions of your logframe at the touch of a button, without having to create different versions of the same document as you would in a text editor or a spreadsheet application. For instance, you could print an overview of the risks and assumptions for each objective, without showing the indicators or verification sources:
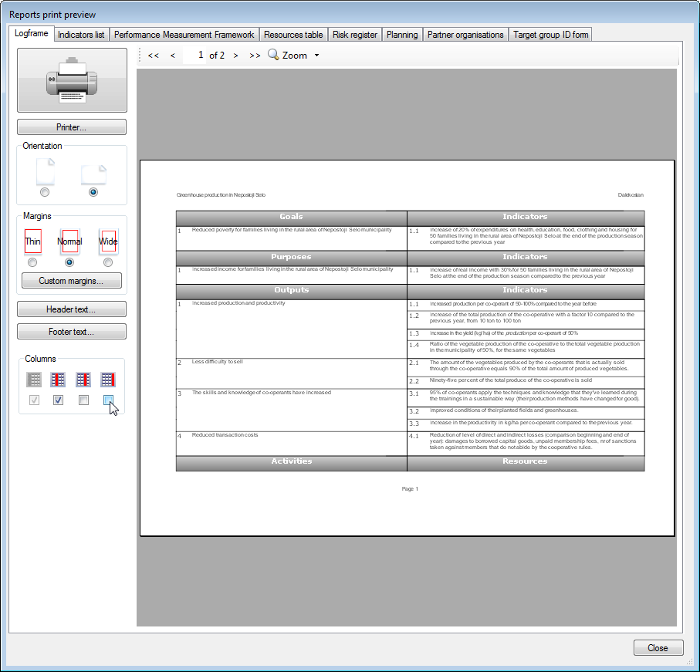
List of indicators print preview
If you select the Indicators list tab of the Reports print preview window or you've clicked in one of the cells of the Indicator details window before opening this window, you will get the following preview:
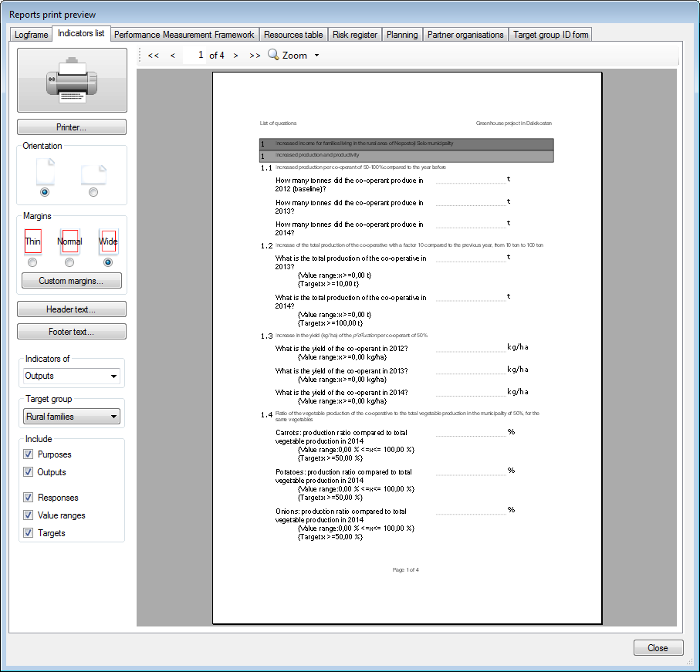
Underneath the usual settings of the Print Settings Bar, you can set different options to select what information you want to include in this report.
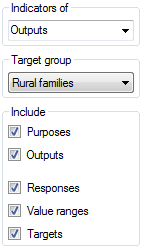 You can select:
- Which indicators you want to include, meaning from which level of your logframe: impact indicators, outcome indicators, output indicators, activity indicators (progress indicators) or all indicators.
- To which target group the indicators belong: when designing indicators, you can set to which specific target group each indicator belongs. This way you can create different documents (questionnaires) for different target groups, only showing the relevant indicators for that specific group. Using the Target group setting, you can select any of the target groups you've identified, or else choose to include all target groups.
- Which type of information to include in the document:
- Purposes and outputs: if you uncheck these options, you will only see the actual questions (indicators) on your form. If you check them, they will be used as headers.
- Responses: if you check this option, you will get the options lists and space to enter the responses to the questions. If you uncheck this option, only the actual indicators will be listed.
- Value ranges and targets: if you check this option, the value ranges and targets will be included in curly brackets {}. If you include the value range, the person completing the list will be able to see what minimum and maximum values he or she has to respect. Including the targets is more for internal use - you probably don't want the respondents to know what the 'right' answer is.
Below you can see an example of a list of indicators without value ranges or targets:
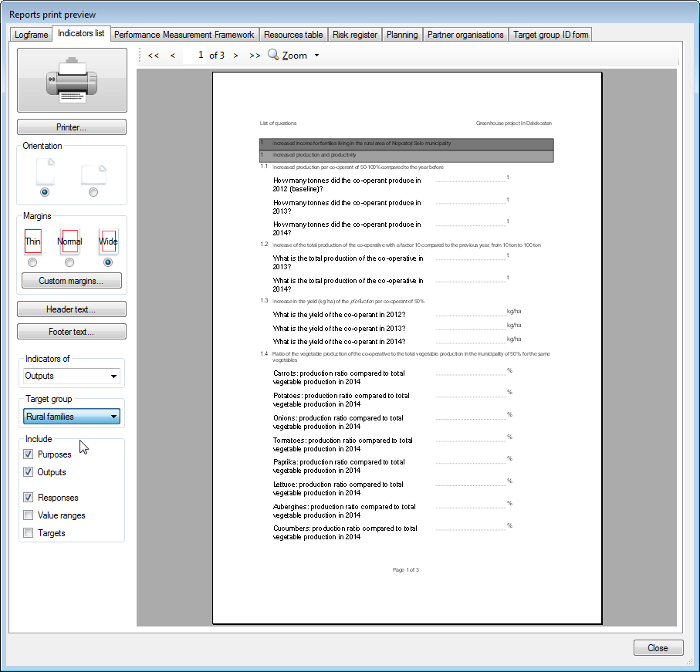
Performance Measurement Framework print preview
The Performance Measurement Framework is tool used for Results Based Management. It is a table that presents an overview about:
- The expected goals, purposes or outputs
- How you will follow-up progress (indicators)
- Baseline information and targets at the end of the project
- What data sources (verification sources) you will use
- How you will collect data
- At what frequency
- Who's responsible for the data collection.
If you select the Performance Measurement Framework tab of the Reports print preview window or you've clicked in one of the cells of the Verification sources details window before opening this window, you will get the following preview:
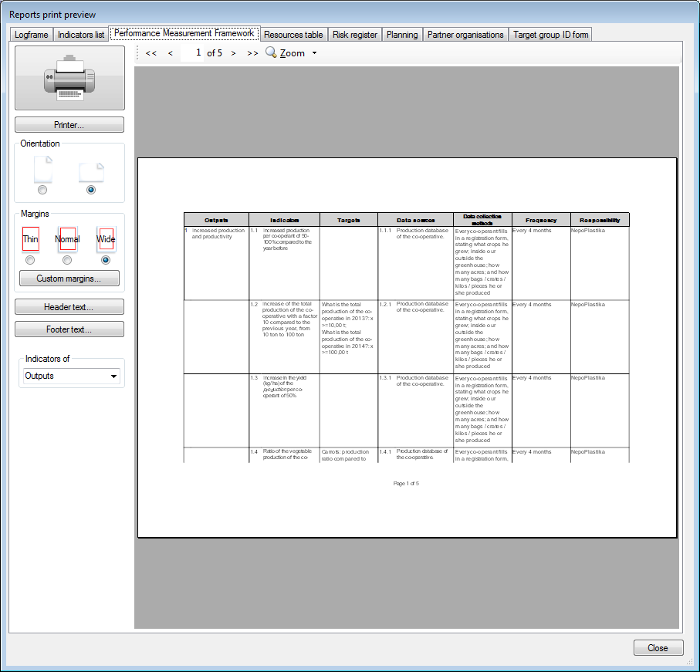
The only option for the PMF table is which indicators you want to include:
- Indicators of the goals (impact indicators)
- Indicators of the purpose(s) (outcome indicators)
- Indicators of the outputs
- All indicators
The Resources Table print preview
Note: the following feature is only available in version 1.2 (or later) of Logframer
The resources table gives you an overview of all the resources that are used for each activity. Basically, it is a print-out of the Resources Detail window.
The table of resources is not the same as the budget of the project. In Logframer you can detail costs for each activity, but some of these may overlap between activities. This means that it is not possible to make a correct total for the whole of your project.
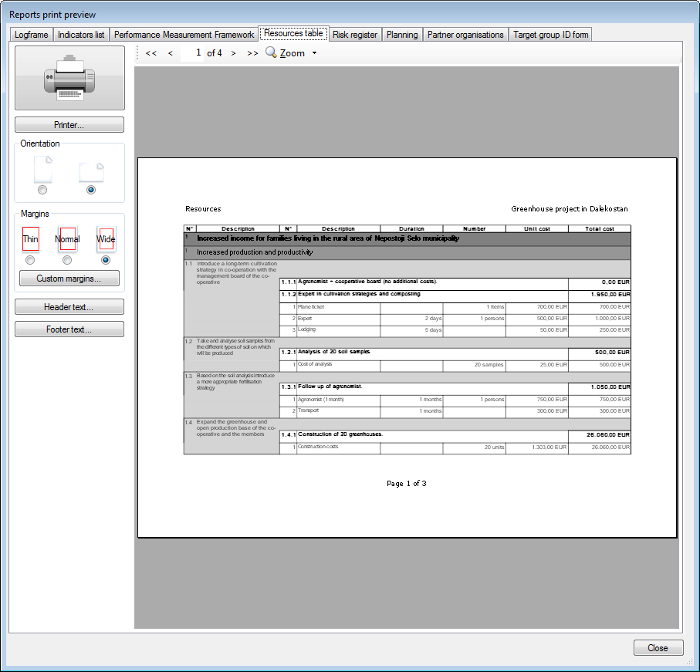
The Risk Register print preview
If you select the Risk register tab of the Reports print preview window or you've clicked in one of the cells of the Assumptions details window before opening this window, you will get the following preview:
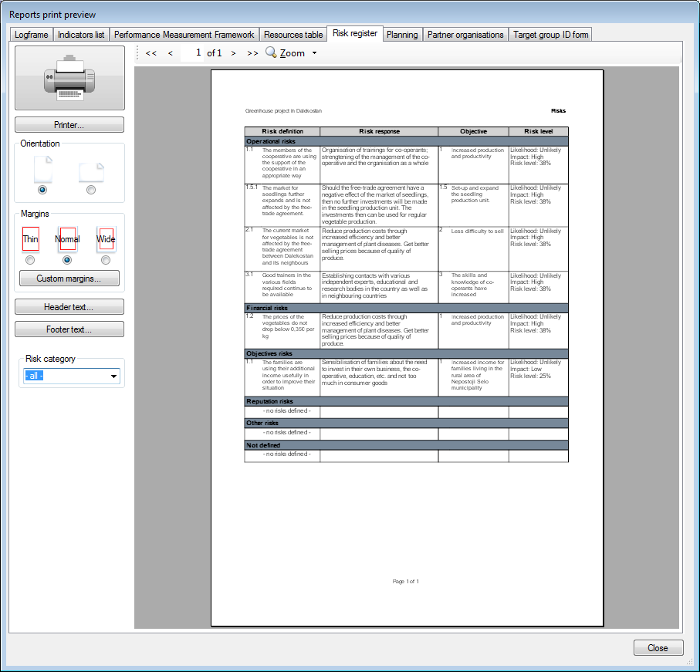
You can select different categories of risks:
- operational risks
- financial risks
- objectives risks
- reputation risks
- other risks
- all risks
Planning print preview
You can open the Planning print preview in two ways. You can either use the Print preview button in the General toolbar, or open the Planning window first and then use its Print preview button.
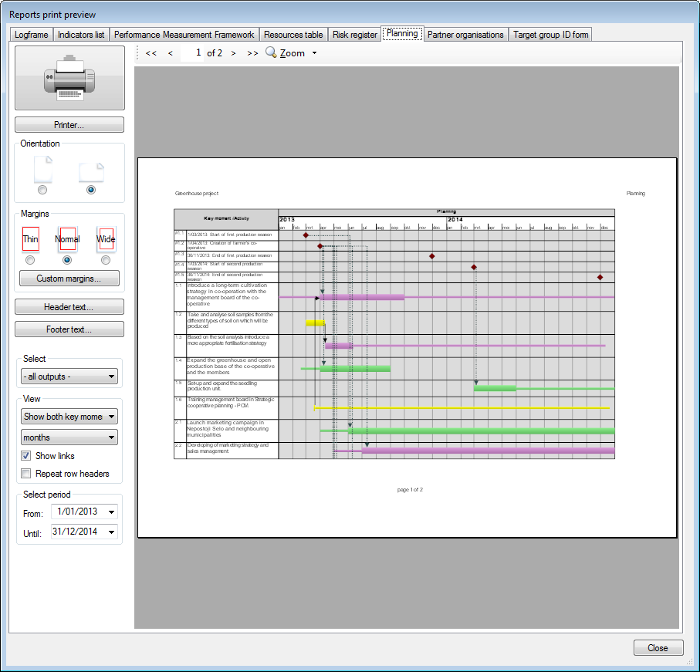
The Planning print preview uses the settings of the Planning window, so if you looked at the day-to-day planning in that window you will also get the day-to-day planning in the print preview. This is important to remember, because if you've selected a long period of time in day-to-day mode and then open the print preview, it may take a (very) long time to complete the preview. In that case you better select a monthly overview of the planning, open the print preview window, then select a shorter period of time and finally select 'View: days'.
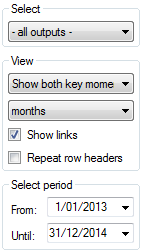
As in the Planning window, you can select which activities you want to see (using the Select drop-down list). You can choose to see both key moments and activities or activities only. You can also show or hide the links between key moments and activities.
With the Repeat row headers check box, you can choose whether you want the row headers with the names of the activities to be printed on each individual page. If you deselect this option, the row headers will only be printed on the first page. On the following pages, you will only see the number of each activity, but not its text:
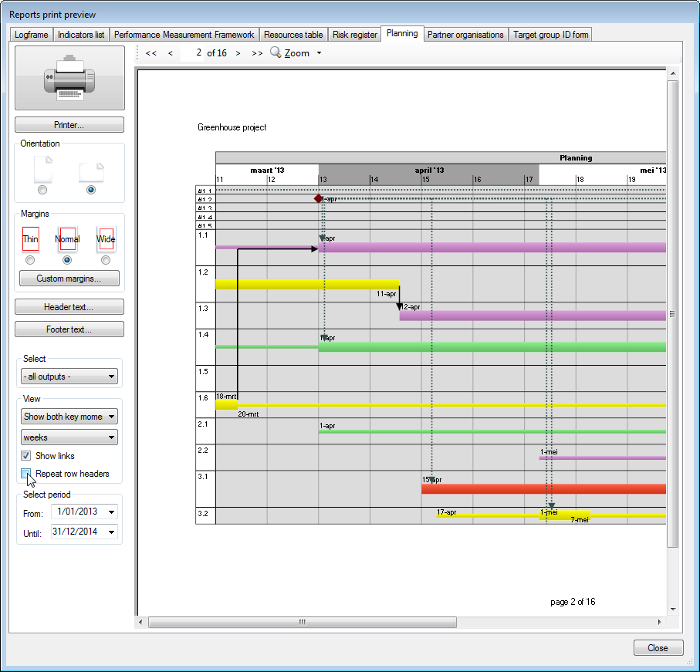
To get a detailed view of a certain period, you can set the starting date and the end date.
Partner List print preview
If you select the Partner organisations tab of the Reports print preview window, you will get the following preview:
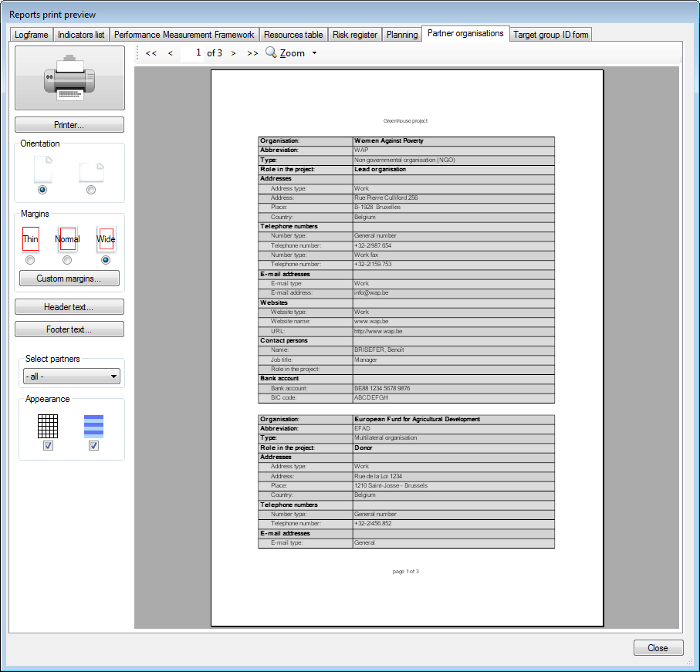
You can select of which partner you want to print the details, or you can choose to print all partners' information at once.
You can change the appearance of the table using the two check boxes at the bottom. You can:
- Add or remove the table grid
- Add or remove colour to the table. The rows of the table will have alternating colours.
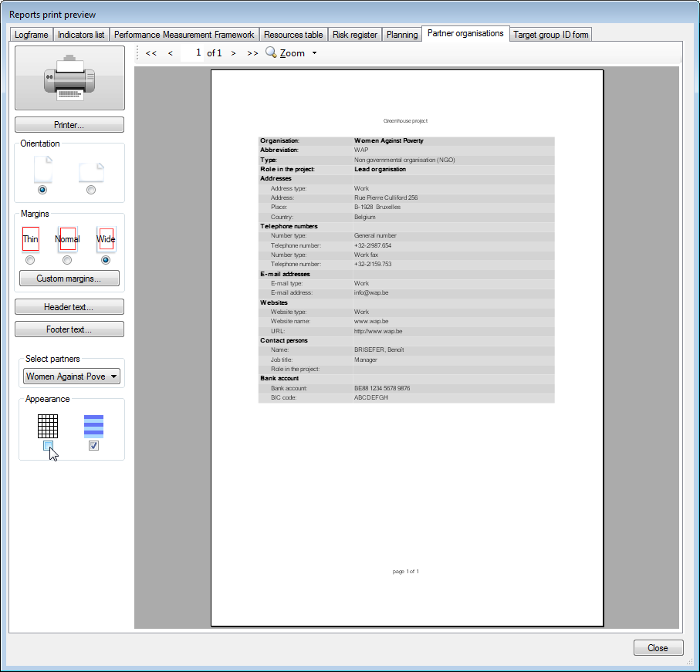
Target Group ID Form print preview
If you select the Target group ID form tab of the Reports print preview window or you've clicked in one of the cells of the Target Groups details window before opening this window, you will get the following preview:
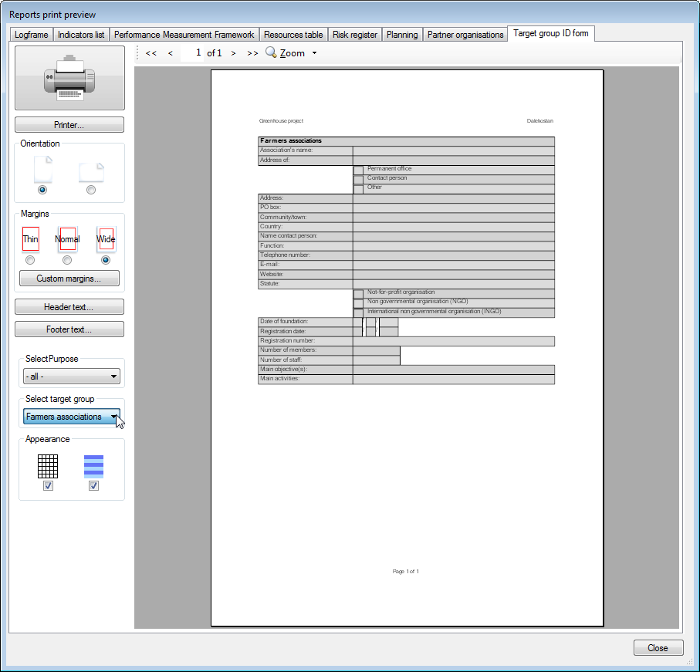
You can select the target group for which you want to print the form. You'd probably want to select just one target group at a time, so you can make many copies of the form and use them in the field. But you can also print all the different forms one after the other in a single document.
You can change the appearance of the table using the two check boxes at the bottom. You can:
- Add or remove the table grid
- Add or remove colour to the table. The rows of the table will have alternating colours.
The Print Reports window
Note: the following feature is only available in version 1.2 (or later) of Logframer
To open the Print Reports window, click on the  button in the General toolbar. Alternatively, you can use the Main menu, by clicking on File → Print…
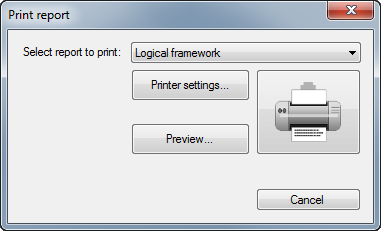
You can select the report to print with the first drow-down list. Depending on which area of the main window you were working in, Logframer will suggest you the corresponding report.
You can select one of the following reports:
- The logical framework;
- The list of indicators
- The Performance Measurement Framework (PMF)
- The resources table
- The Risk Register (RR)
- Your project’s planning
- The list of partners
- The target group identification form
If you press the printer button on the right, the printing process will begin, using the preferences that you set in the Print Preview window. To change these preferences or to see a preview of the report you want before actually printing it, click on the Preview... button.
To change printer related settings, such as which printer to use, the number of copies to print, etc. you can press the Printer settings... button.
Printing in version 1.0 and 1.1
The print and print preview interface has been changed since Logframer 1.2. On the following pages, you can find information about how to print in the first two versions of Logframer (1.0 and 1.1)
Using the Print and Print preview buttons in the General toolbar, you can print or preview:
- Your logical framework;
- The list of indicators
- The Performance Measurement Framework (PMF)
- The Risk Register (RR)
- Your project’s planning
- The list of partners
- The target group identification form
To print one of these reports, simply click into the related area. For instance, if you want to print your logical framework, you click on one of the cells, and then on the Print or Print preview button.
For the other reports, you must make sure that the Details section is visible by clicking on the button in the Lay-out toolbar. Then click in the Detail window in the bottom of your screen and finally on the Print or Print preview button.
Alternatively, you can use the Main menu, by clicking on File → Print… or File → Print preview…
Page set-up
You can select the paper size, change the orientation of the paper and adapt the printing margins with the Page set-up dialog.
To open this dialog, select File → Lay-out → Page lay-out…
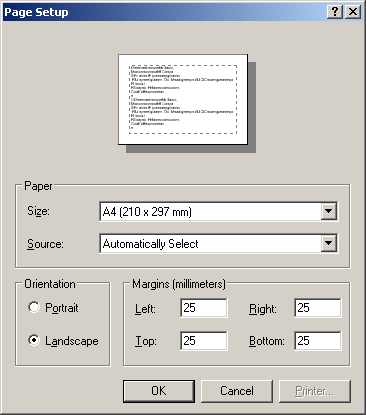
Printing your logframe
To print your logical framework, simply click on one of its cells, and then on the Print or Print preview button.
Logframer automatically rearranges the width of your columns, so that your logframe will fit the width of your paper. You do not have to worry whether everything will fit on your paper, or make manual adjustments. Secondly, Logframer will also hide the empty cells, to make maximum use of the available space.
Instead of printing your whole logframe, you can choose to print only the first column, or only the objectives and the assumptions, or the objectives, indicators and verification sources, and so on. To do so:
- In the design window, hide the columns you want to hide using the Column lay-out buttons .
- Then press the Print or Print preview button
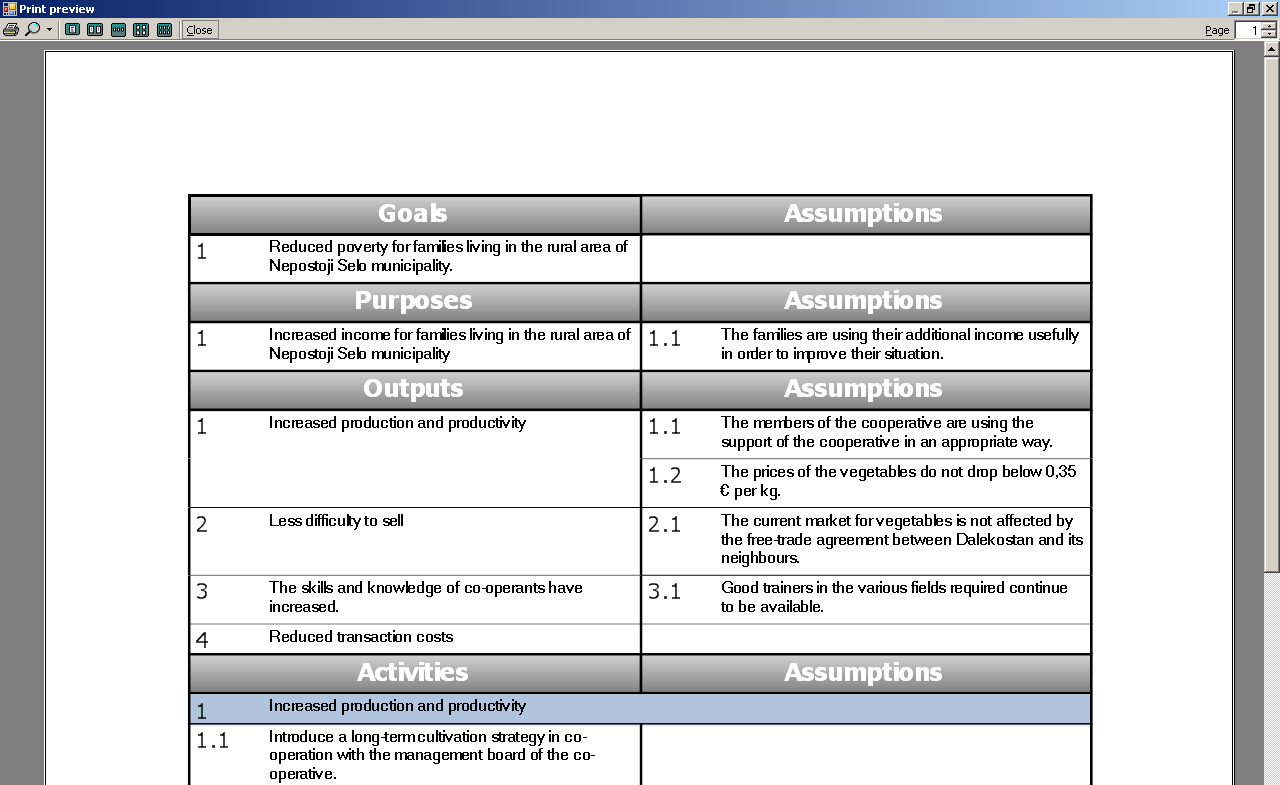
Printing the list of partners
The list of partners is a table with basic information about each partner, including its name, its role in the project and contact information (addresses and contact persons).
To print directly, click on File → Print... → Print list of partners in the Menu bar, or File → Print preview... → Print preview of list of partners to get a preview first. Logframer will show you the following dialog box:
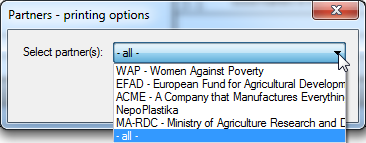
You can choose to print information about all your partners, or just info about a single partner. When you've made your choice, click < Ok > to continue.
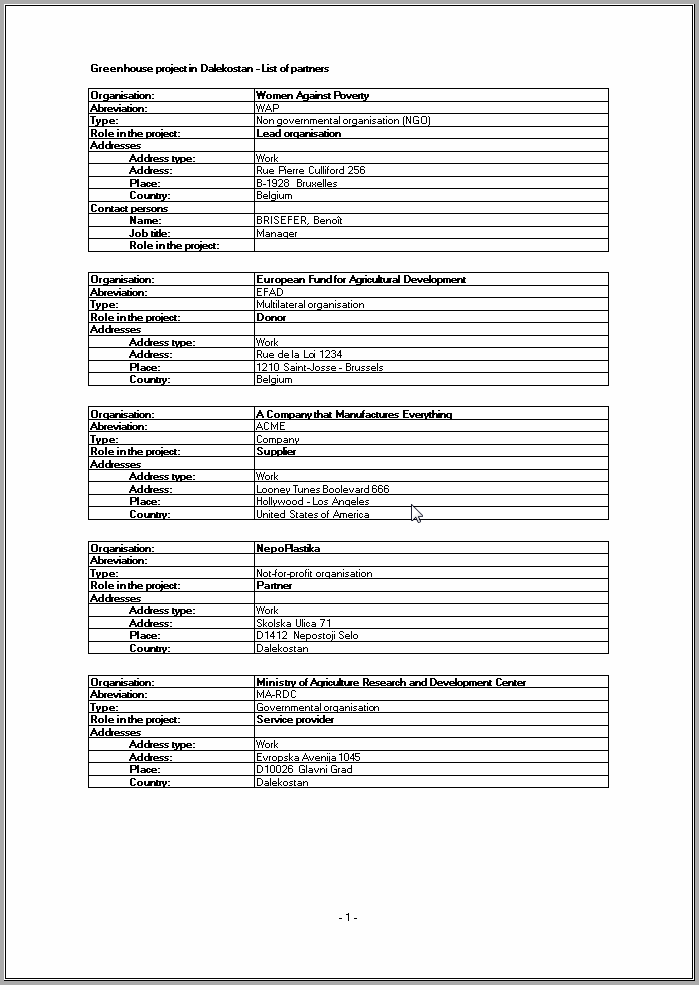
Printing the target group identification form
The target group identification form is a form that can be used in the field to identify beneficiaries. This form allows you to identify the beneficiary by his/her name, address and other contact information. You can also add any other relevant information using custom fields. To add custom fields, see the chapter about Identification of your target group.
To print directly, click on File → Print... → Print target group ID form in the Menu bar, or File → Print preview... → Print preview of target group ID form to get a preview first. Logframer will show you the following dialog box:
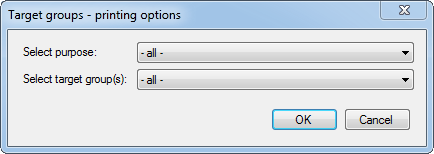
You can select the purpose (if you have more than one purpose) and the target groups of that purpose (if you have more than one target group). Alternatively, you can print identification forms for all target groups of all purposes.
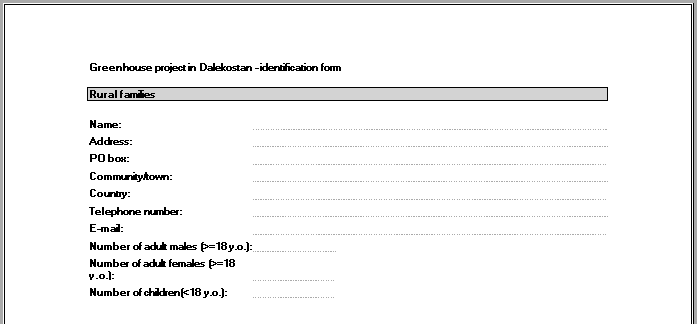
Printing the list of indicators
The list of indicators prints your indicators in the form of a list or a questionnaire. To print this list, click on File → Print... → Print indicators or File → Print preview... → Print preview of indicators. You will then get the following window, where you can select a number of options:
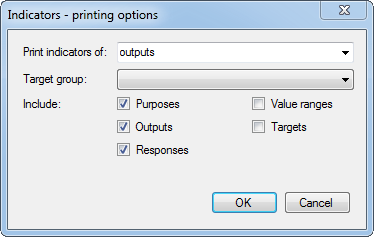
First of all, you can select which indicators you want to include in your list or questionnaire:
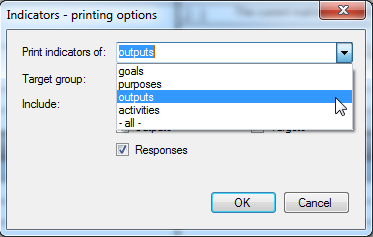
Generally you'll want to use the output indicators to monitor the results of your project. Then, if you've got more than one target group in your project, you can select from which target group you want to print the indicators. This means that you can create a questionnaire specifically for one target group, instead of having all the different indicators mixed up in your form.
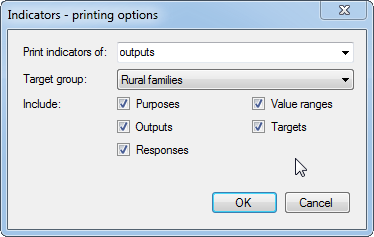
Underneath you can see a series of check boxes. These allow you to specify what information you want to include. The first two options allow you to choose whether you want to show the purpose(s) and outputs to which the indicators belong. This is handy if you want to have a clear overview, but if you want to use the list as a questionnaire, you may want to uncheck these options. Otherwise the respondents will know why you ask a certain question and that may influence their answer.
If you want to have a detailed overview of your indicators, including for each indicator the possible answers (responses), value ranges and targets, you should check the last three options. But again, if you want to create a questionnaire that you'll hand out to the respondents, then you may want to uncheck these options. Otherwise they'll see what the 'right' answers are. For an interviewer, it is important to know what the value ranges are, but again you may want to hide the targets so that he or she can't accidentally give away the right answer.
Once you've selected the options that you want, you can press the < Ok > button.
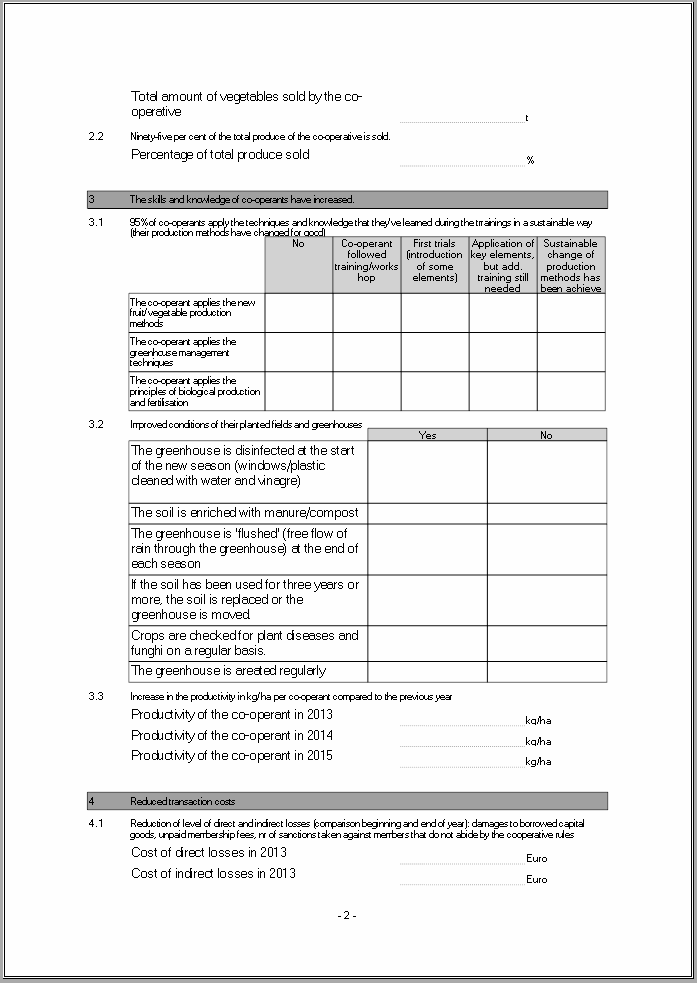
Printing the Performance Measurement Framework (PMF)
The Performance Measurement Framework is a table that presents an overview about:
- The expected goals, purposes or outputs
- How you will follow-up progress (indicators)
- Baseline information and targets at the end of the project
- What data sources (verification sources) you will use
- How you will collect data
- At what frequency
- Who's responsible for the data collection.
In the Menu bar, click on File → Print... → Print Performance Measurement Framework (PMF) or File → Print preview... → Print preview of Performance Measurement Framework (PMF). Logframer will show you the following window:
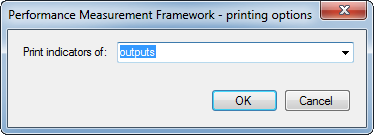
Here you have the option of creating a PMF with:
- The goals and their indicators, verifications sources, etc.
- The purpose(s) and its (their) indicators etc.
- The outputs and their indicators etc.
- All objectives and their indicators, verifications sources, baselines, data collection methods etc.
Click < Ok > to continue.
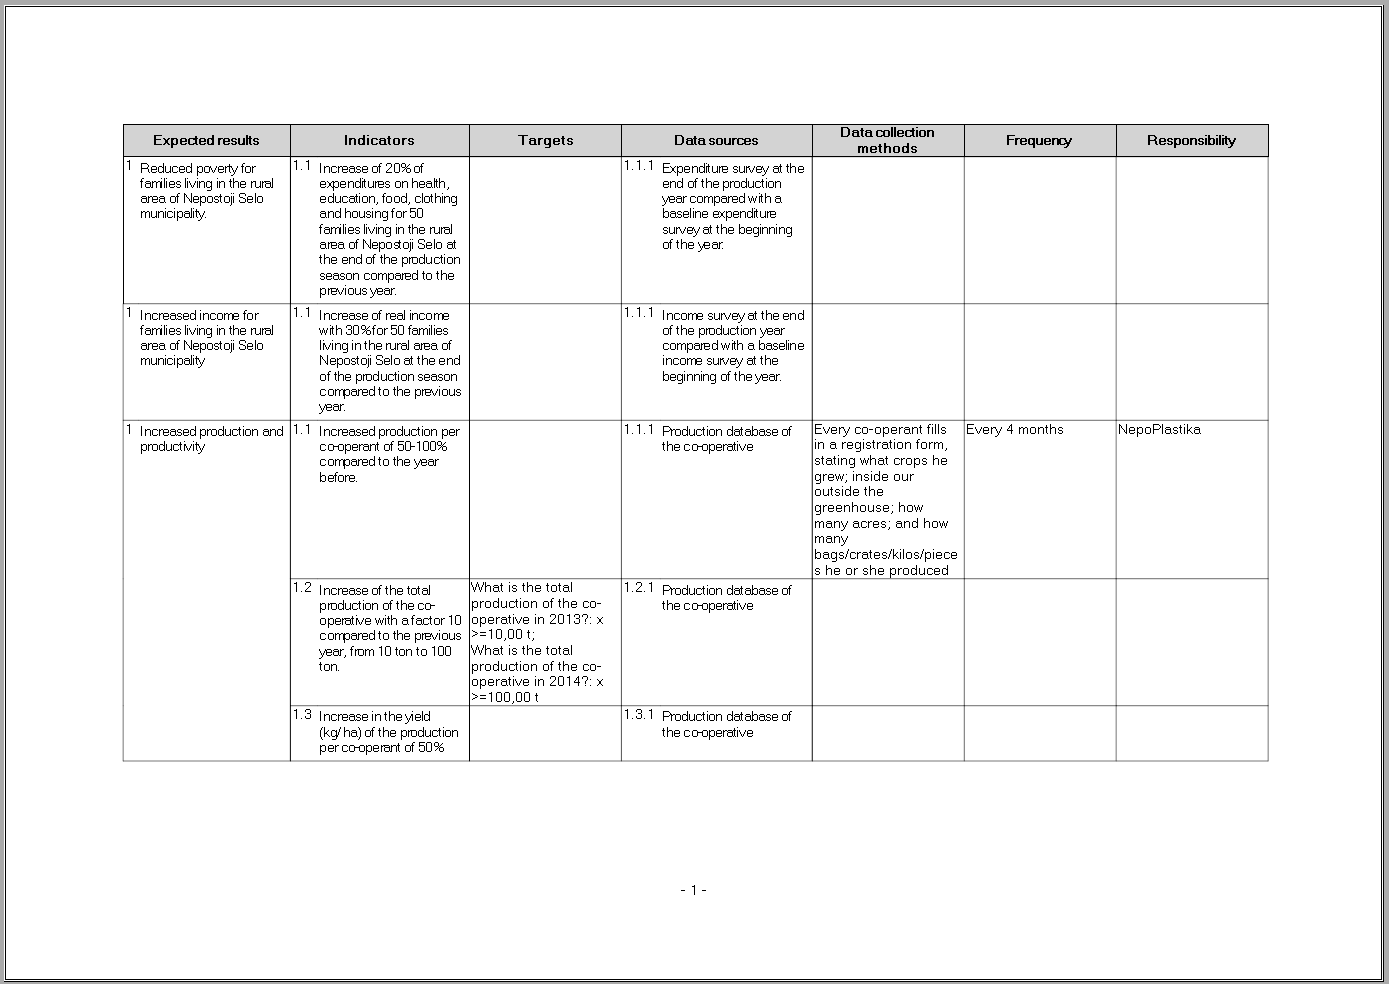
Printing the Risk Register (RR)
To print the risk register, click on File → Print... → Print Risk Register. To see the print preview of the risk register, go to File → Print preview... → Print preview of Risk Register.
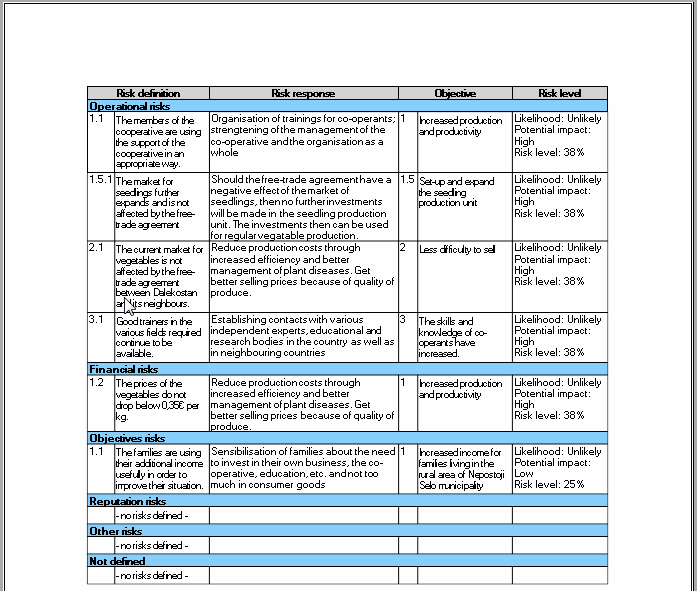
Printing your project’s planning
To print the planning, click on File → Print... → Print Planning. To see the print preview, go to File → Print preview... → Print preview of Planning.
Alternatively, you can open the Planning window by clicking on the button in the Lay-out toolbar. Then in the planning window you can click on the  buttons to print or see the print preview respectively.
In both cases you will get the following dialog:
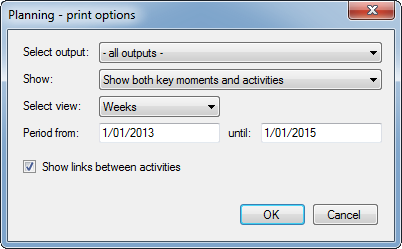
Here you can select a number of options:
- For which output you want to see the activities; if you select - all outputs - you will see the planning of your whole project.
- Whether you want to see both key moments and activities, activities only or key moments only
- The level of detail: planning per day, per week, per month or per year
- For which period you want to see the planning. By default you get the entire length of your project, but you can select any period you want within the course of your project.
- Finally, you can choose whether you want to show the links (arrows) between the activities and key moments. If you uncheck the box the links won't show.
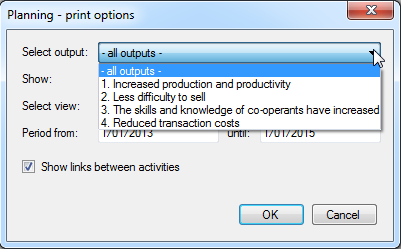 |
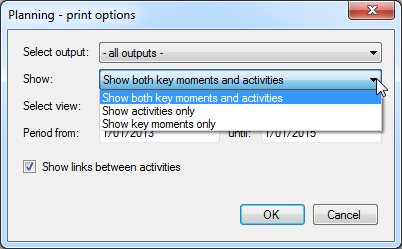 |
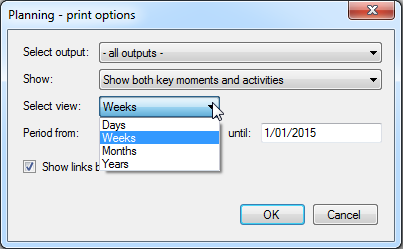 |
When you press the < OK > button you will get the preview, or the printing will begin.
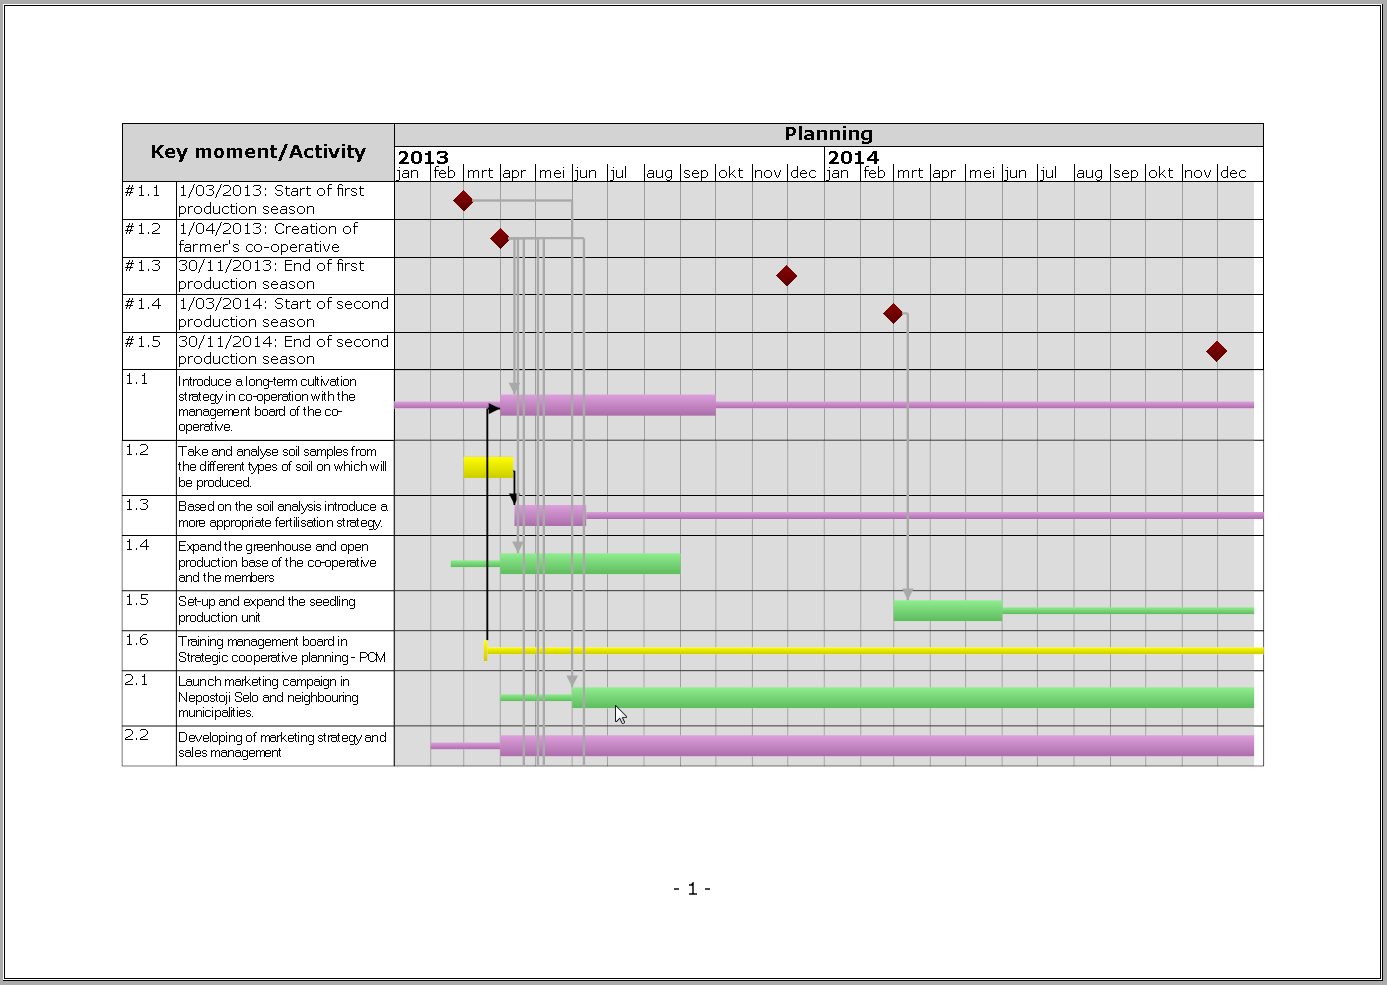
Importing from and exporting to Microsoft Office Applications
If you have been designing and managing projects for a while, you may have a whole series of existing logframes that you've made in Microsoft Excel or Word. With Logframer, you can easily import these documents.
Once you've designed your logical framework, you can simply print it, but more often than not you will need to include it in a project proposal or in your project's documentation. Logframer allows you to export your logframe into new or existing Microsoft Word or Microsoft Excel documents.
To import or export a logframe, use the options that you find under File in the main menu bar.
Importing a logical framework made in MS Word or Excel
You can import an existing logical framework made in Microsoft Excel or Microsoft Word.
- Importing an existing Logical framework from an MS Excel workbook.
- Importing an existing Logical framework from an MS Word document.
The procedure to import a logframe is almost identical for the two types of documents.
Importing an existing logical framework from a MS Excel workbook
To import an existing logframe from a Microsoft Excel™ spreadsheet, go to File → Import → Logframe from MS Excel file.
Note: before importing an Excel document, it's best to make sure that the document is not opened in Excel because this may slow down the importing process considerably. If you're editing a cell in a worksheet, the importing process may even block down completely.
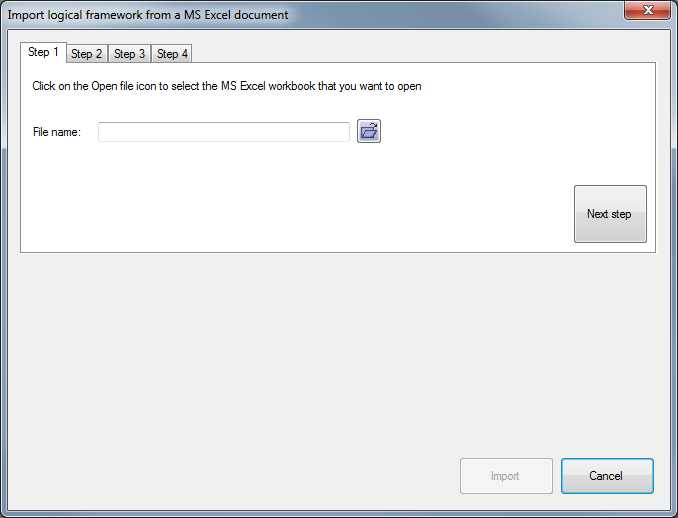
The import process consists of four steps:
- Select the MS Excel document that contains your logical framework
- Select the sheet that contains your logframe
- Indicate which columns contain the objectives, indicators, verification sources and assumptions
- Indicate the rows that contain the goals, purposes, outputs and activities
After you've completed a step, click on the Next step button to proceed. When you've filled out all the information, you can press the Import button on the bottom.
Once you've imported the logical framework, you'll have to shuffle things around a bit. Because Logframer doesn't know which activity belongs to which output and which output belongs to which purpose, they are all placed under the first output or purpose respectively. However, it's easy to move them to their correct location.
The following pages describe the importing process for version 1.2 or higher of Logframer. For information about importing in older versions, follow this link.
Selecting the Excel document that you want to import
The first step is to select the file that you want to import. Press on the  button to open the File selection dialog. Navigate to the file you want to import, select it and then click Ok.
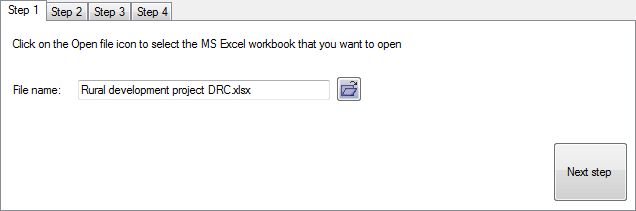
Once you've selected the file, you will see a preview of the first worksheet in the bottom half of the window.
Press the Next step button to proceed.
Select the sheet that contains your logframe
If the worksheet that is shown below does not contain your logframe, you can use the drop-down list to select the correct worksheet.
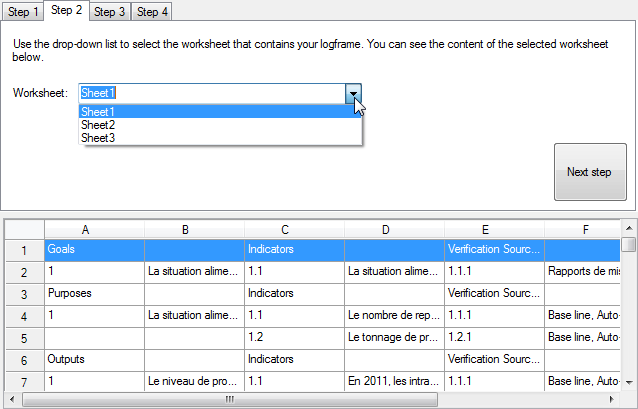
Press the Next step button to proceed.
Choosing the columns of your logframe
Next you need to indicate in which columns the objectives, indicators, verification sources and assumptions can be found. You only need to select the columns that contain the actual text. If you've numbered each item in a separate column in your Excel document, you needn't worry about the numbering. Logframer will renumber all the items.
For instance, in the example below you can see that column A contains the numbers of the goals, purposes, outputs, etc. So the actual Objectives column is B.
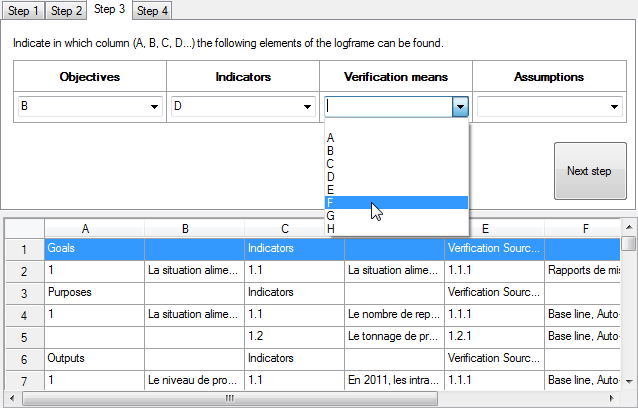
Press the Next step button to proceed
Indicate the different sections
Finally, you have to indicate for each section in which rows the objectives, indicators, etc. can be found. This means that for each section, you enter the number of the first and the last row. Do not include any title rows (if you do, these will also be imported and then you have to remove them manually because Logframer uses its own section titles).
For instance, in the example below, the first row is a title row. So the goals section starts on the second row. There is only one goal in this project, so the goals section also ends on the second row. Row 3 again is a title row, and the purposes section starts on row 4.
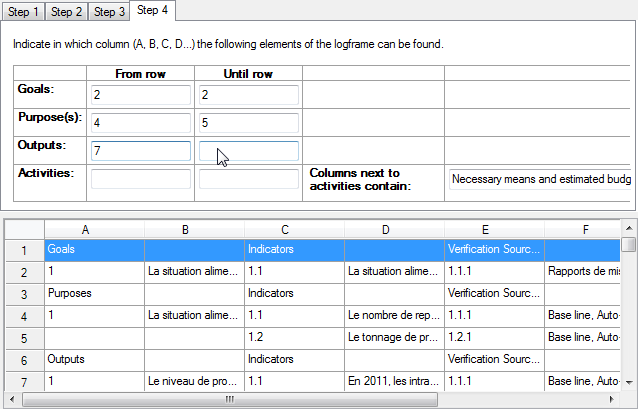
You can also select what information can be found in the second and third column of the Activities section. In most cases, this is where you'd put the necessary resources and the budget for each resource. But if you use progress indicators to check how your activities are doing, you can do that too.
You don't need to import a whole logframe. If you only want to import goals and purposes for instance, but not the outputs or activities, you just complete the start and end rows for the first two sections.
Importing an existing Logical framework from an MS Excel spreadsheet (version 1.0 and 1.1)
This page describes the importing process for versions 1.0 and 1.1 of Logframer. For help about importing in version 1.2 or higher, follow this link
To import an existing logframe from a Microsoft Excel™ spreadsheet, go to File → Import → Logframe from MS Excel file.
The following dialog box will appear. Click on the button on the right of the text box to select the file you want to import.
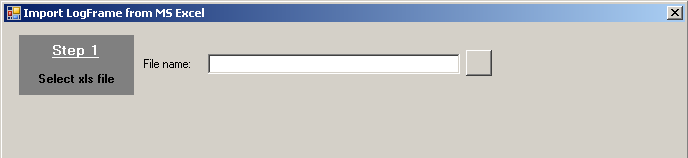
Logframer will open the file and give a preview of the first worksheet in the workbook. If there are multiple worksheets, you can select the correct one using the dropdown box on top of the preview, which lists all of the available worksheets.
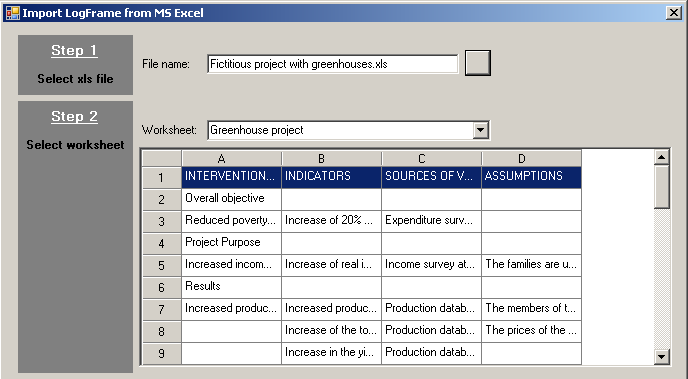
In the third step, you need to indicate which columns contain the objectives, the indicators, the verification sources and the assumptions.
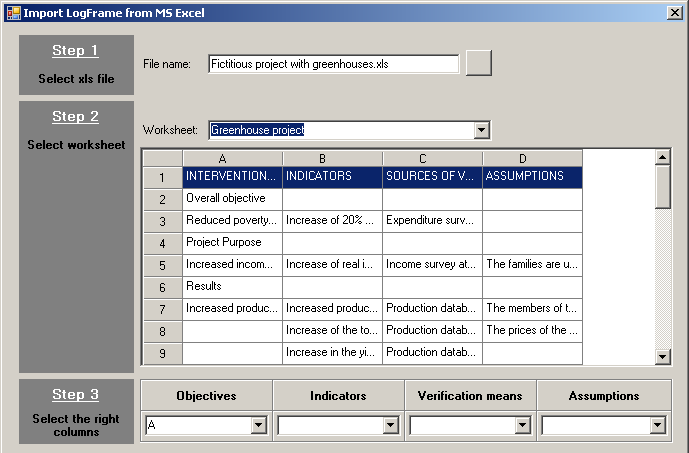
Finally, in the fourth step you need to indicate the first and last row of the goals, purpose(s), outputs and activities.
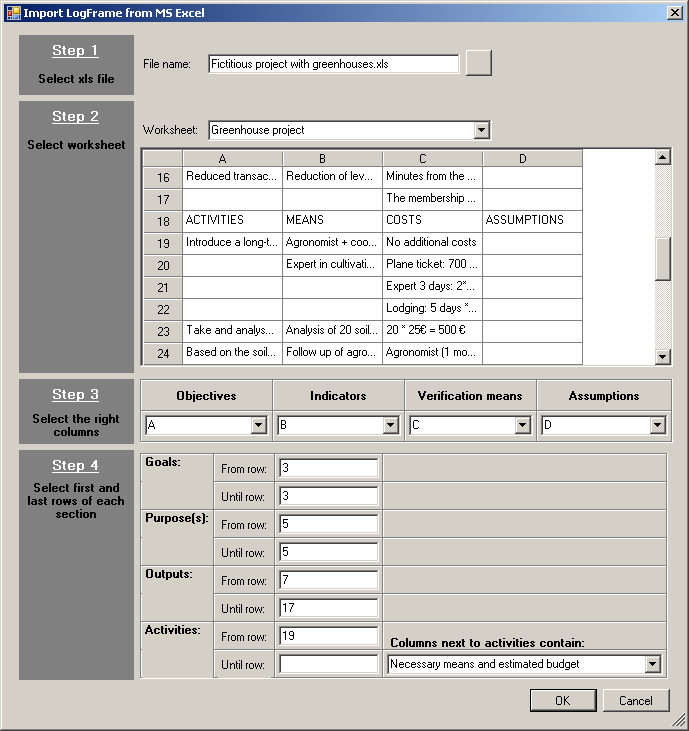
Do not include the title rows (i.e. containing the words ‘Goals’, ‘Purposes’, ‘Indicators’, ‘Assumptions’, etc.). As a final option, you can indicate whether the columns next to the Activities column contain the means and budget of the project, or rather the process indicators and their verification sources (generally, it will be the first option).
After you’ve pressed the < OK > button, Logframer will import your logical framework. Don’t forget to save once the spreadsheet is imported.
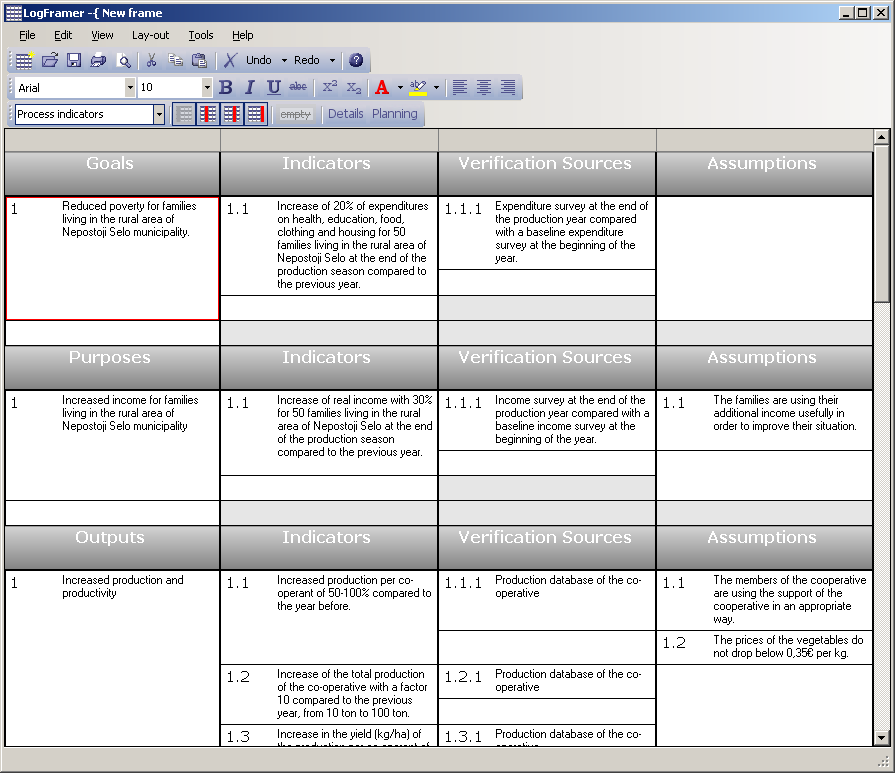
Notice that Logframer automatically numbers all the items (objectives, indicators, verification sources, etc.). However, you should check the numbering of the activities if you have more than one output. Logframer will link all the activities to the first output, so you may have to move the activities around from the first output to one of the others, using the left mouse button to drag-and-drop them.
Similarly, if you have more than one purpose in your logframe, you will see that after the import all outputs are listed under the first purpose.
Importing an existing Logical framework from a MS Word document
Note: the following feature is only available in version 1.3 or higher
To import an existing logframe from a Microsoft Excel spreadsheet, go to File → Import → Logframe from MS Word document.
Note: before importing an Word document, it's best to make sure that the document is not opened in Word because this may slow down the importing process considerably.
You can only import a logical framework if you made it in a table. Furthermore, this table must not contain any vertically merged cells. If the table does contain vertically merged cells, the importation process will break off.
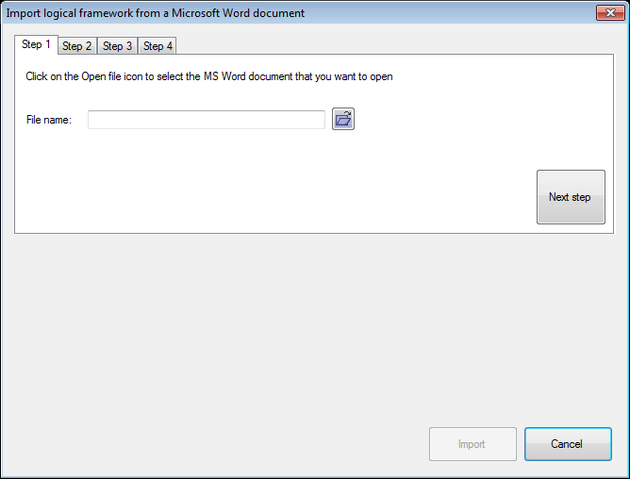
The import process consists of four steps:
- Select the MS Word document that contains your logical framework
- Select the table that contains your logframe
- Indicate which columns contain the objectives, indicators, verification sources and assumptions
- Indicate the rows that contain the goals, purposes, outputs and activities
After you've completed a step, click on the Next step button to proceed. When you've filled out all the information, you can press the <Import> button on the bottom.
Once you've imported the logical framework, you'll have to shuffle things around a bit. Because Logframer doesn't know which activity belongs to which output and which output belongs to which purpose, they are all placed under the first output or purpose respectively. However, it's easy to move them to their correct location.
Selecting the Word document
The first step is to select the file that you want to import. Press on the button to open the File selection dialog. Navigate to the file you want to import, select it and then click Ok.
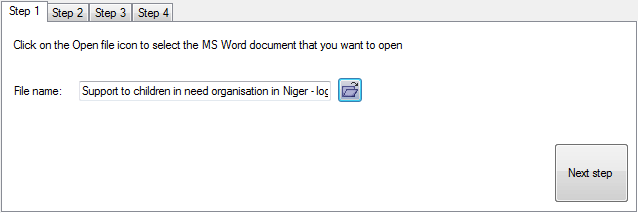
Once you've selected the file, you will see a preview of the first table in the bottom half of the window.
Before loading the first table, Logframer will verify that the table does not contain any cells that are vertically merged (two or more cells located on top of each other that were merged). If the table does contain such cells, you will get the following warning:
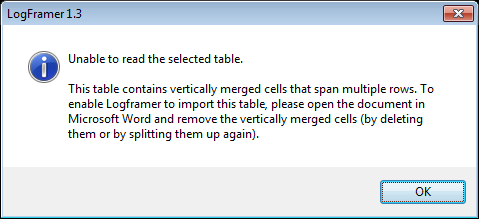
In this case, open the document in Word and split up any merged cells in the table. Then try importing again.
Press the Next step button to proceed.
Select the table that contains your logframe
If the document contains multiple tables and the one that is shown on the bottom does not contain your logframe, you can use the drop-down list to select the correct table.
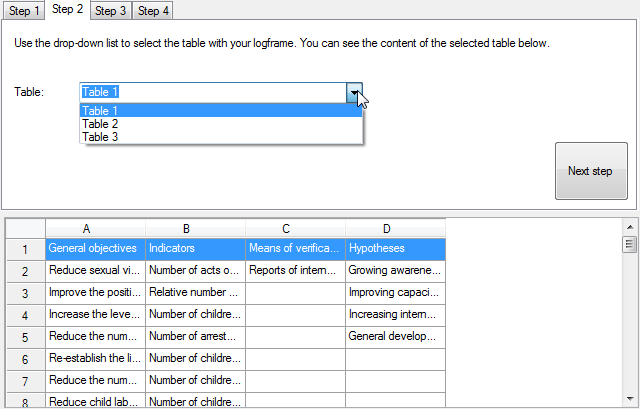
Press the Next step button to proceed.
Choosing the columns of your logframe
Next you need to indicate in which columns the objectives, indicators, verification sources and assumptions can be found. You only need to select the columns that contain the actual text. If you've numbered each item in a separate column in your Word document, you needn't worry about the numbering. Logframer will renumber all the items.
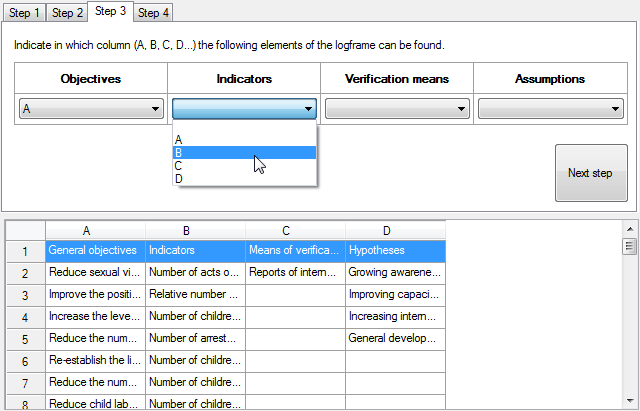
Press the Next step button to proceed
Indicate the different sections
Finally, you have to indicate for each section in which rows the objectives, indicators, etc. can be found. This means that for each section, you enter the number of the first and the last row. Do not include any title rows (if you do, these will also be imported and then you have to remove them manually because Logframer uses its own section titles).
For instance, in the example below, the first row is a title row. So the goals section starts on the second row. The goals section also ends on the tenth row. Row eleven again is a title row, and the purposes section starts on row twelve.
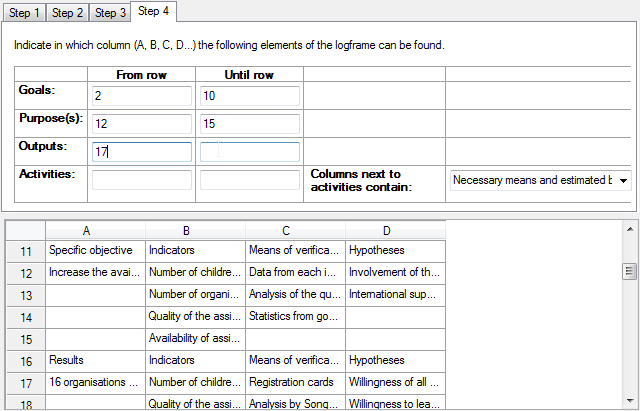
You can also select what information can be found in the second and third column of the Activities section. In most cases, this is where you'd put the necessary resources and the budget for each resource. But if you use progress indicators to check how your activities are doing, you can do that too.
You don't need to import a whole logframe. If you only want to import goals and purposes for instance, but not the outputs or activities, you just complete the start and end rows for the first two sections.
Exporting reports and views to Microsoft Excel and Microsoft Word
Once you've designed and completed your logical framework and other information related to your project in Logframer, you can create different reports in Microsoft Word and Microsoft Excel. This way, you can use all this information directly in your project files and funding applications.
You can export the following reports to MS Word:
- The logical framework
- The list of indicators
- The Performance Measurement Framework
- The Risk Register
- The table of resources
- The project's planning
- The list of partners
- The target group identification forms
You can export the following reports to MS Excel:
Exporting to Microsoft Word
You can export the following reports to Microsoft Word:
- Your logical framework
- The list of indicators
- The Performance Measurement Framework
- The Risk Register
- The table of resources
- The project's planning
- The list of partners
- The target group identification forms
To export to Word, go to File → Export → Export to MS Word
When you select one of the options above, you will get the following dialog:
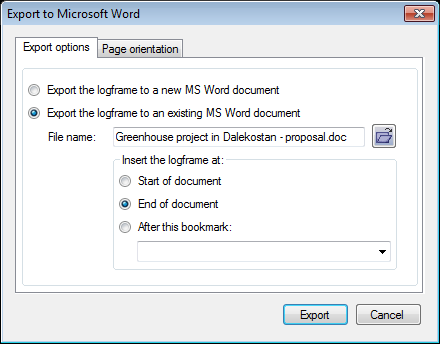
You have two main export options
- You can export your report to a new Microsoft Word document.
- You can insert your report into an existing MS Word document, for instance a project proposal that describes the project in general. You can insert the report:
If you click on the tab 'Page orientation', you can select the page orientation of the report:
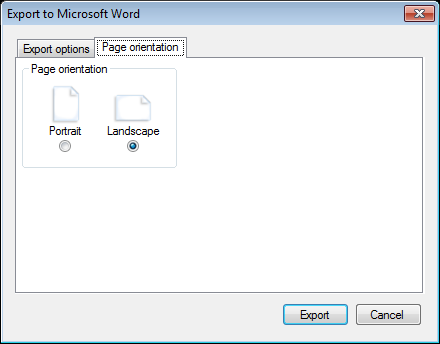
If you want to create a new Word document with your report, the page orientation of the whole document will be either set to portrait or landscape mode. When you insert your report in an existing document, Logframer will create a new section in the document in the selected page orientation. That means that when you have a document in normal (portrait) mode, but your report is too large to fit it in (the columns will become too thin), you can safely select landscape mode and insert the report without it affecting the lay-out of your entire document.
For some reports, other options will be available. In that case an additional tab will appear.
Export options
You have two main export options:
- You can export your report to a new Microsoft Word document.
- You can insert your report into an existing MS Word document, for instance a project proposal that describes the project in general. You can insert the report:
Creating a new MS Word document with your report
To create a new MS Word document with your report, simply select the first option. Logframer will open Microsoft Word and create a new document with your report.
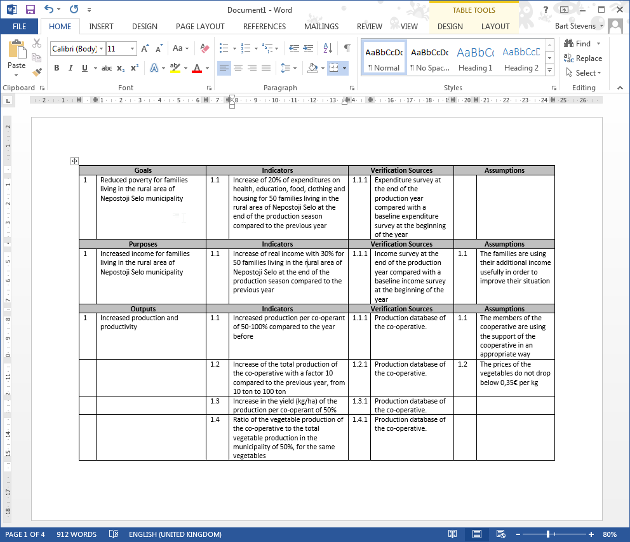
Inserting your report at the start or the end of a document
If you want to insert your report into an existing document, choose the second option. Then click on the Open File button on the right, and select the Microsoft Word document in which you want to insert the report.
You can insert the report at the beginning of the document, at the end of the document or after a bookmark. Inserting it at the start or the end of the document is easiest and requires no preparation. Just make your choice and press the < Ok > button.
Inserting your report at a specific place in your document
What about when you want to insert the report at a specific place in your document? Well you can: all you need to do is open your text in MS Word and insert a bookmark right on the spot where you want to insert the table or list.
Select the ‘Insert’ tab on the ribbon. Then in the ‘Links’ section, select Bookmark.
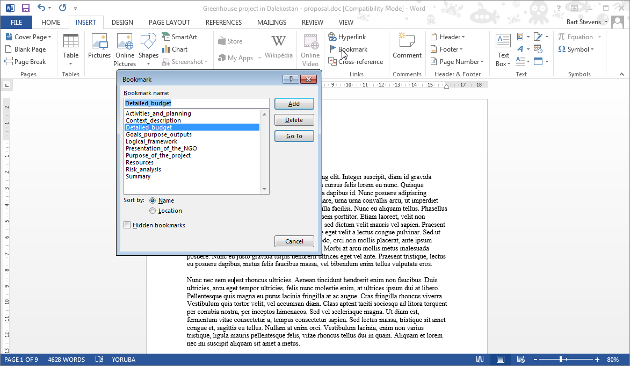
In Microsoft Word 2003, click on Insert → Bookmark...
This will open the following dialog window:
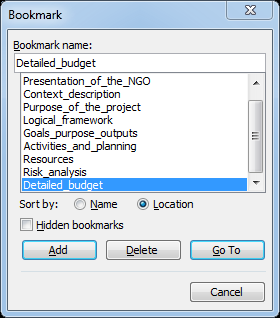
Give your bookmark a name, and click on the < Add > button. Then close the document in Word and return to Logframer.
In Logframer, proceed as you would for inserting your report in an existing Word document, but choose the third option. Then choose the bookmark you just added from the drop-down list at the bottom (the list automatically updates when you select the document in the File name box).
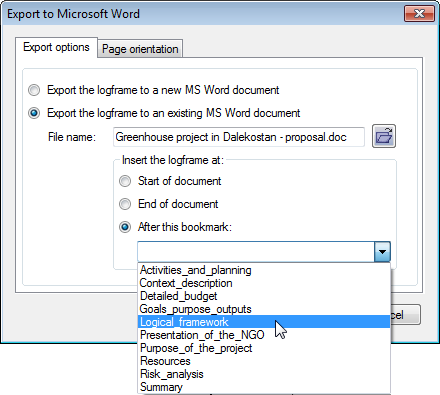
When you've selected the right bookmark, click on the < Ok > button to insert your report at that specific spot.
Exporting your logical framework to a MS Word document
In the Menu bar, click on File → Export → Export to MS Word → Export Logframe.
Your logical framework will be exported as you see it in Logframer. That means that when you hide the assumptions column in Logframer, you will get a logframe in Word with the first three columns.
The advantage is that you can just as easily create different custom views of your logframe in MS Word, while you only have to design your logical framework once in Logframer.
Exporting the list of indicators to a Microsoft Word document
Instead of showing your indicators in a logical framework, often you'll want to present them in the form of a list or a questionnaire. To create such a list, click on File → Export → Export to MS Word → Export list of indicators. The Export to Word dialog will have an additional tab, where you can select a number of options:
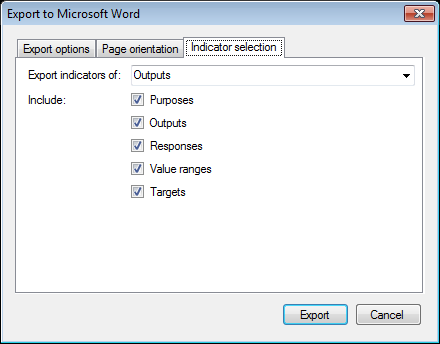
First of all, you can select which indicators you want to include in your list or questionnaire:
- Goal indicators
- Purpose indicators
- Output indicators
- Activity indicators (if you've defined any)
- All indicators of your logframe
Generally you'll want to use the output indicators to monitor the results of your project.
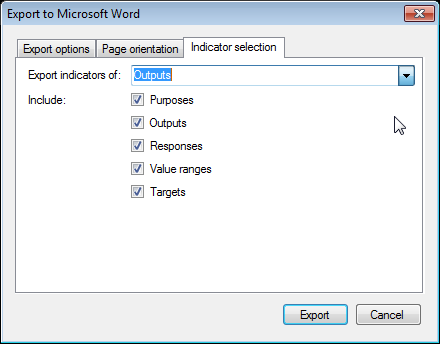
Underneath you can see a series of check boxes. These allow you to specify what information you want to include. The first two options allow you to choose whether you want to show the purpose(s) and outputs to which the indicators belong. This is handy if you want to have a clear overview, but if you want to use the list as a questionnaire, you may want to un-check these options. Otherwise the respondents will know why you ask a certain question and that may influence their answer.
If you want to have a detailed overview of your indicators, including for each indicator the possible answers (responses), value ranges and targets, you should check the last three options. But again, if you want to create a questionnaire that you'll hand out to the respondents, then you may want to un-check these options. Otherwise they'll see what the 'right' answers are. For an interviewer, it is important to know what the value ranges are, but again you may want to hide the targets so that he or she can't accidentally give away the right answer.
Once you've selected the options that you want, you can press the < Ok > button. Logframer will start up Microsoft Word and create a new document that looks something like this:
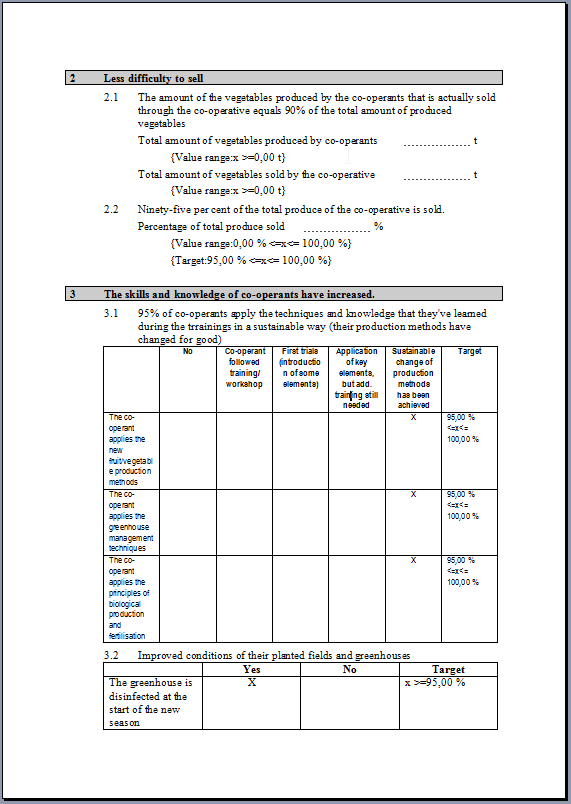
Exporting the Performance Measurement Framework to a MS Word document
In the Menu bar, click on File → Export → Export to MS Word → Export Performance Measurement Framework.
The Performance Measurement Framework presents information about:
- The expected results
- How you will follow-up progress (indicators)
- Baseline information and targets at the end of the project
- What data sources (verification sources) you will use
- How you will collect data
- At what frequency
- Who's responsible for the data collection.
Logframer fills out all the columns, except the 'Baseline data' column which you have to complete yourself when you establish the baseline. In the course of the project, you can add columns to the right of this column with information of the progress on your indicators.
Exporting the Risk Register to a MS Word document
In the Menu bar, click on File → Export → Export to MS Word → Export Risk Register.
The Risk Register classifies the risk/assumptions that you've defined in five categories:
- Operational risks
- Financial risks
- Objectives risks
- Reputation risks
- Other risks
If you didn't set the type of risk in the Details window of your assumptions, then the risks will appear in a sixth category: 'Not defined'.
For each risk, the RR lists what your response will be to that risk, to what objective the risk is linked and finally the risk level.
The risk level depends on the likelihood of the risk (very unlikely, unlikely, likely, very likely) and the potential impact of the risk should it occur (very low, low, high, very high). The risk level score is based on these two factors and is expressed as a percentage.
Note that when you export the Risk Register to a Microsoft Word document, there are no formulas included in the table to calculate the risk level as you would in the Excel version.
Exporting the table of resources to a MS Word document
Note: the following feature is only available in version 1.3 or higher
In the Menu bar, click on File → Export → Export to MS Word → Export table of resources.
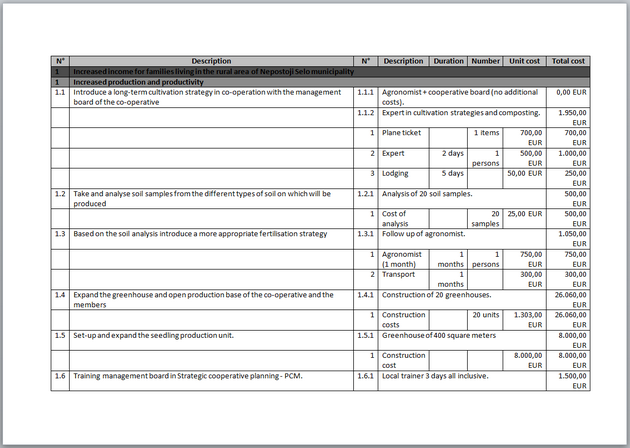
Exporting the project's planning to a MS Word document
Note: the following feature is only available in version 1.3 or higher
In the Menu bar, click on File → Export → Export to MS Word → Export planning.
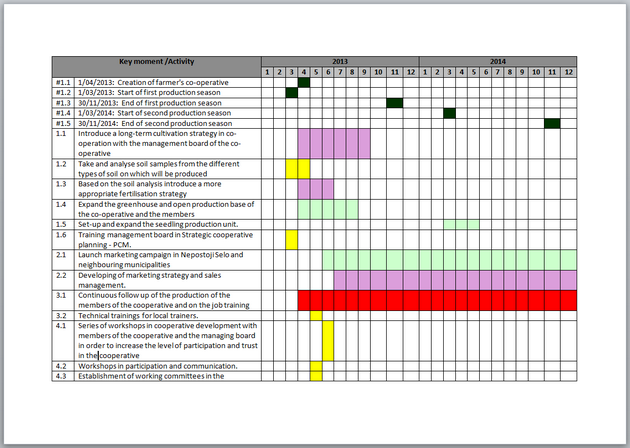
The table presents the planning per year and month only (not per week or day).
Exporting the list of partners to a MS Word document
Note: the following feature is only available in version 1.3 or higher
In the Menu bar, click on File → Export → Export to MS Word → Export list of partners.
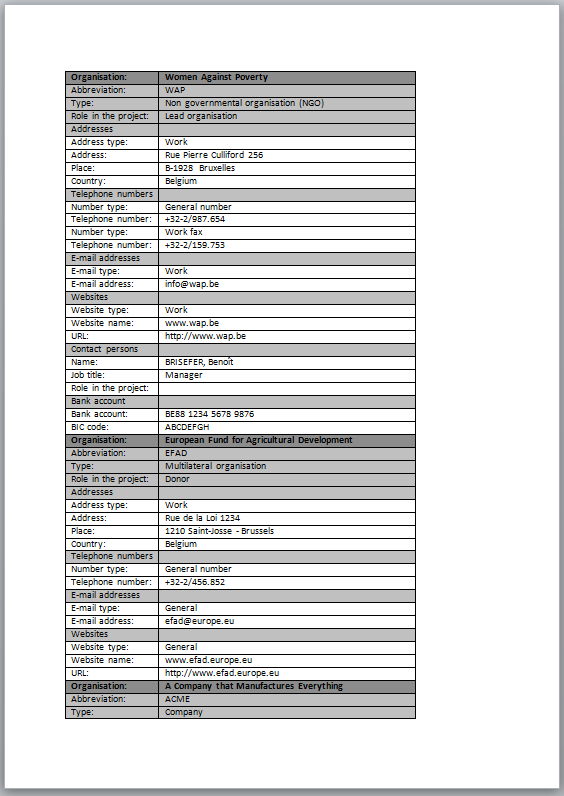
Exporting the target group ID forms to a MS Word document
Note: the following feature is only available in version 1.3 or higher
In the Menu bar, click on File → Export → Export to MS Word → Export target group ID forms.

Exporting to Microsoft Excel
You can export the following reports to Microsoft Excel:
To export to Excel, go to File → Export →Export to MS Excel
Exporting your logical framework to a new MS Excel workbook
In the Menu bar, click on File → Export →Export to MS Excel →Export Logframe. Logframer will open Microsoft Excel and create a new workbook with your logical framework.
The logical framework will be exported as you see it in Logframer. That means that when you hide the assumptions column in Logframer, you will get a logframe in Excel with the first three columns (or rather six columns: column A contains the numbers of the objectives, column B the actual objectives, column C the numbers of the indicators, column D the actual indicators and so on).
This means that you can easily create custom views of your logframe in Excel, while you only have to design your logical framework once in Logframer.
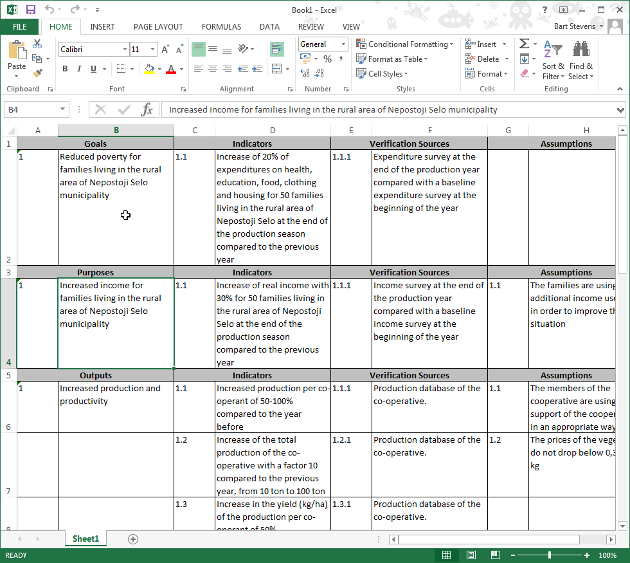
Exporting the Performance Measurement Framework to a new MS Excel workbook
In the Menu bar, click on File → Export →Export to MS Excel →Export Performance Measurement Framework. Logframer will open Microsoft Excel and create a new workbook with the PMF.
The Performance Measurement Framework presents information about:
- The expected results
- How you will follow-up progress (indicators)
- Baseline information and targets at the end of the project
- What data sources (verification sources) you will use
- How you will collect data
- At what frequency
- Who's responsible for the data collection.
Logframer fills out all the columns, except the 'Baseline data' column which you have to complete yourself when you establish the baseline. In the course of the project, you can add columns to the right of this column with information of the progress on your indicators.
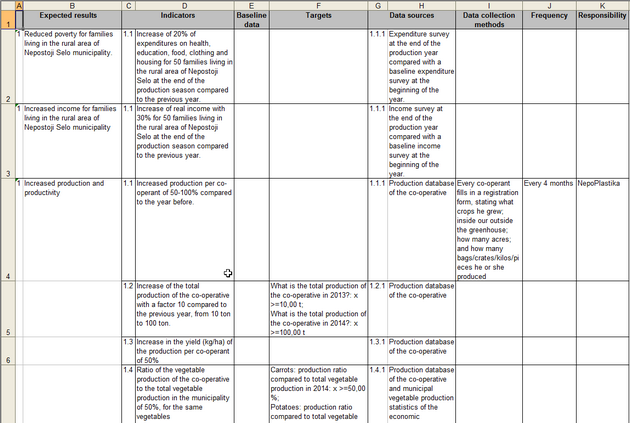
Exporting the Risk Register to a new MS Excel workbook
In the Menu bar, click on File → Export →Export to MS Excel →Export Risk Register. Logframer will open Microsoft Excel and create a new workbook with the register.
The Risk Register classifies the risk/assumptions that you've defined in five categories:
- Operational risks
- Financial risks
- Objectives risks
- Reputation risks
- Other risks
If you didn't set the type of risk in the Details window of your assumptions, then the risks will appear in a sixth category: 'Not defined'.
For each risk, the RR lists what your response will be to that risk, to what objective the risk is linked and finally the risk level.
The risk level depends on the likelihood of the risk (very unlikely, unlikely, likely, very likely) and the potential impact of the risk should it occur (very low, low, high, very high). The risk level score is based on these two factors and is expressed as a percentage.
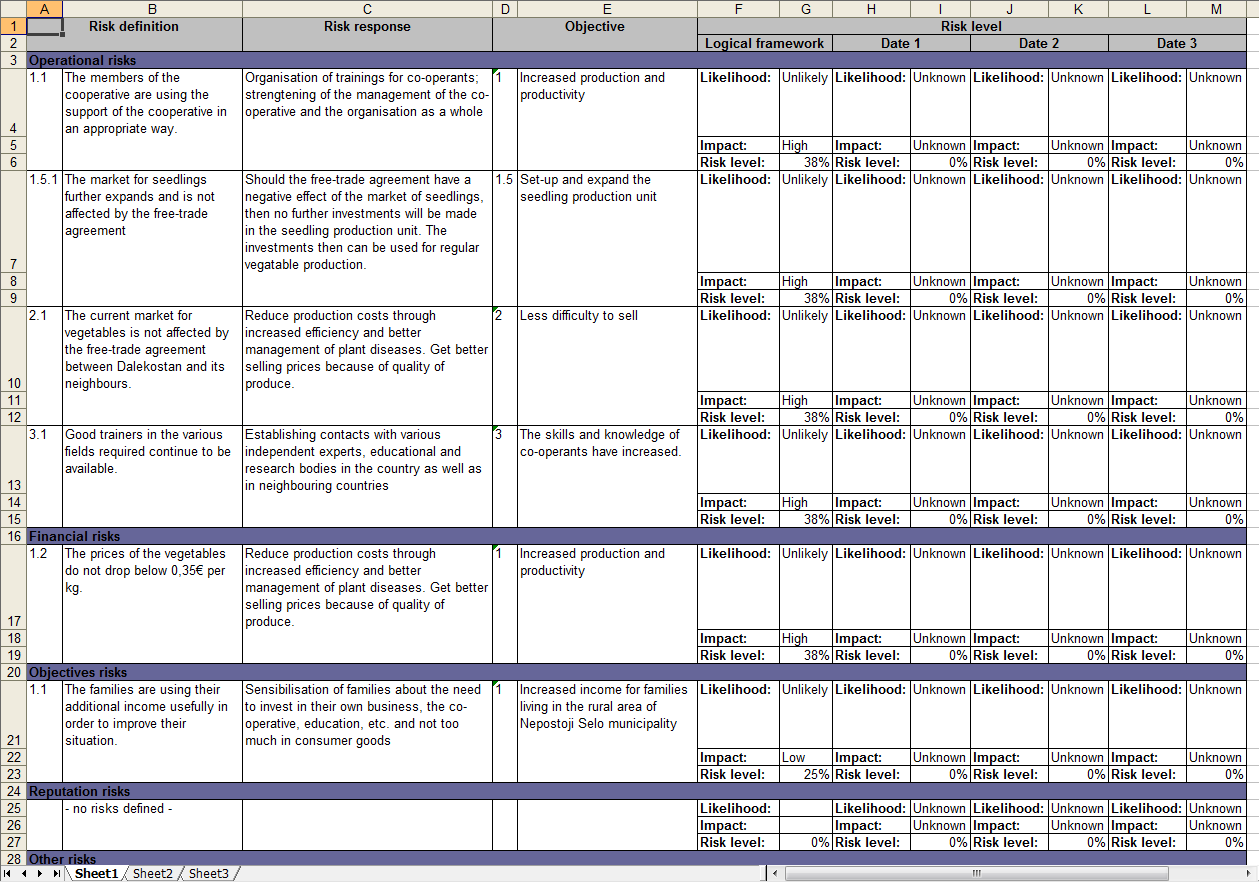
When you create a risk register in Excel, Logframer will include the information of your logframe in the first two columns of the risk level section (columns F and G in this example). Then there are provisions to measure the follow-up the risks at three different dates. At a later stage during the project, the project team can fill out this information. All you have to do at this point is to click on the cell to the right of the one marked 'Likelihood'. You will then see a dropdown list appear.
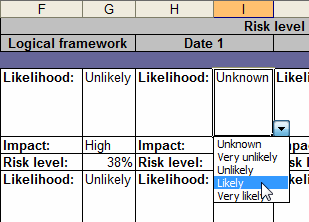
Select the level that represents the likelihood that this risk will occur at that particular point in time. Then you can indicate the potential impact on your project in the same way:
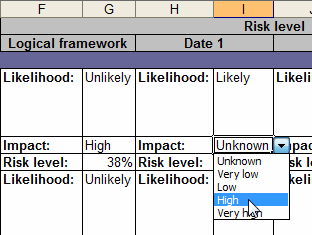
A formula in the cell below will automatically calculate the risk level. In this example, the risk level has risen from 38% to 56% since the creation of the logical framework.
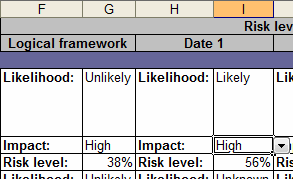
Logframer program settings
In the Menu bar, select Tools → Options… or Tools → Customise… to open the Logframer settings dialog box:
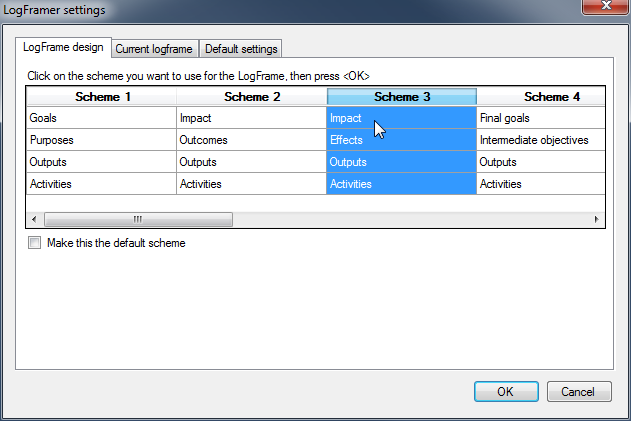
Note: the following feature is only available in version 1.1 or higher
The Logframer options dialog has three tab pages:
- Logframe design: here you can select a scheme for the project logic column (first column) of the current logframe. You can also set this scheme as the default scheme for new logframes.
- Current logframe: here you can set various options for the currently opened logical framework, including how the section titles should look and the fonts of the text in the Details windows and the numbers of the logframe.
- Default settings: similar to the settings of the current logframe, but with a number of additional settings such as the number of files you want to appear in the recent files list
Changing the titles of the Project Logic column
On the tab Logframe design (if you select Tools → Customise… in the Menu bar you will go directly to this tab), you can choose which scheme you want to use for the first column of your logframe.
Note: the following feature is only available in version 1.1 of Logframer
A large number of design schemes has been included in Logframer, including the schemes most commonly used by a number of donor agencies and large organisations.
Click on the column with the scheme of your choice and then press <OK> to change the design scheme of the current logframe. If you want to make this scheme the default scheme for any new logical framework, select the Make this the default scheme-option below.
Changing the appearance of the current logframe
Note: the following feature is only available in version 1.1 of Logframer
You can customise the appearance of the currently opened logframe.
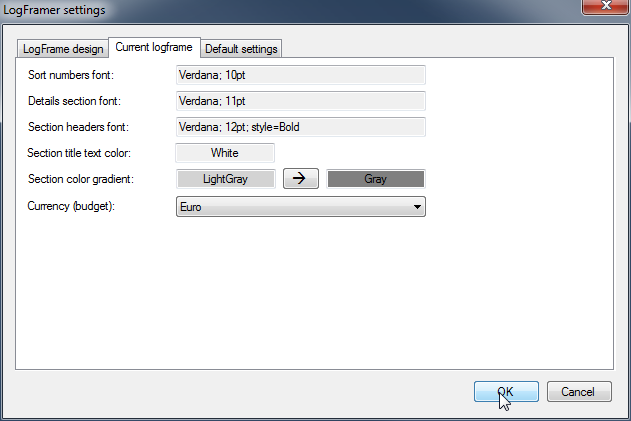
Appearance
You can change the font of the sort numbers and the section headers of the logical framework. You can also change the color gradient of the section titles' background. Choose two different colors to make a gradient, or choose the same colors to get a uniform background.
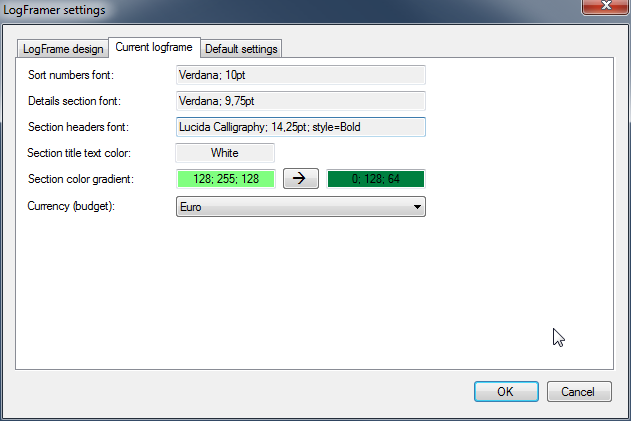
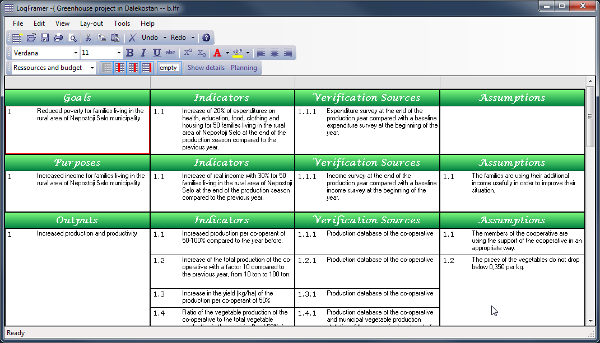
You can also change the font for the Details windows, meaning any text that you can't edit with the word processor options (such as the labels of the indicators which you can set to bold, italics, etc.).
Currency of the budget
Finally, you can select which currency you want to use for the budget column. Use the drop-down list to select any existing currency.
Default settings
If you select the tab Default settings, you can change the following settings:
- The default font of the sort numbers
- The default font of the details section, meaning any text that can't be edited with the word processing tools
- The default font of the section headers and the text colour of the headers
- The background colour of the section titles
- Repeat purposes: by default, when there is more than one purpose Logframer will repeat the purposes in the outputs and activities sections. If you don't want this, uncheck this box.
- Repeat outputs: by default, when there is more than one output Logframer will repeat the outputs in the activities section. If you don't want this, uncheck this box.
- Give a warning when linked elements will be deleted: if you're aware of what child items will be deleted, you may want to uncheck this box to avoid repeated warnings.
- The default indicator type: when you create a new indicator, its response structure is set to that of an open ended question by default. If you generally use another type of question, it's best to change this setting (for instance to Values).
- The default currency for the budget items: when you enter a number in a financial column, Logframer automatically adds a currency. Here you can set the default currency and change it to dollar, pounds, Albanian lek or any other currency.
- The number of files in the recent files list (in the main menu, at the bottom of the File option)
- At which interval you want to automatically save your Logframer document. If you set this value to 0, auto save will be turned off.